On the API Proxy Creation By Time screen, graphs are created or listed according to specified filter fields of the created API Proxies. This screen has two different views; graphic and list.
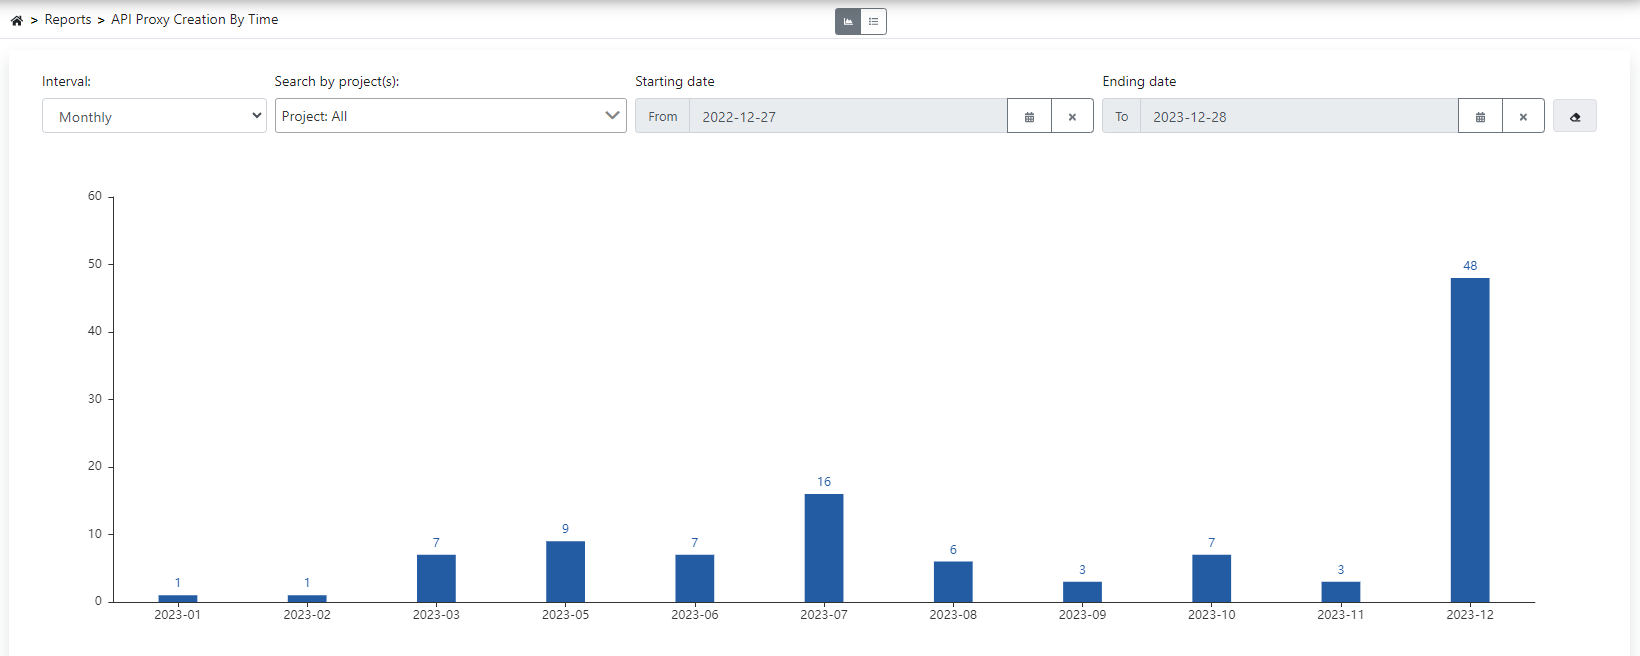
The graphical view gives the information of how many API Proxies were created monthly in the date range determined from the filters, graphically.
The picture below shows the graphic view screen:
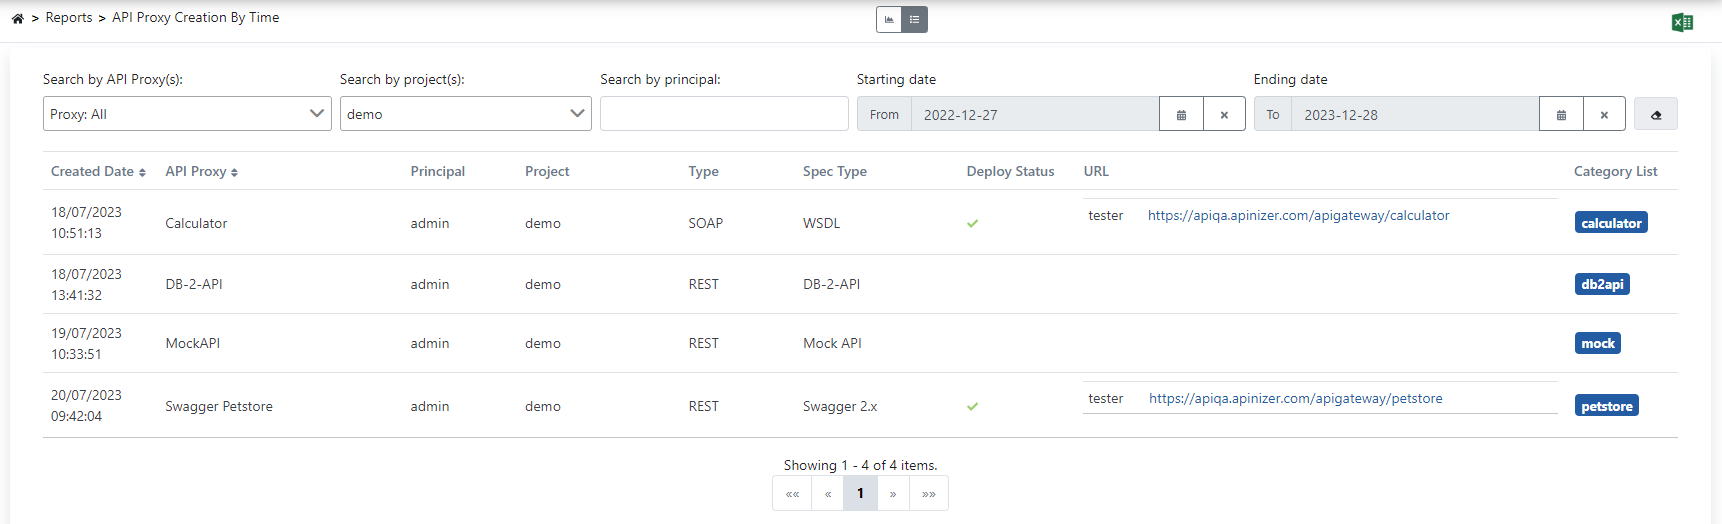
The list view lists the graphic view in detail.
The picture below shows the list view screen: