This report is used to visualize API Traffic by grouping it by time. You can group incoming requests hourly, daily, monthly or yearly, and use the view in graphical or tabular form.
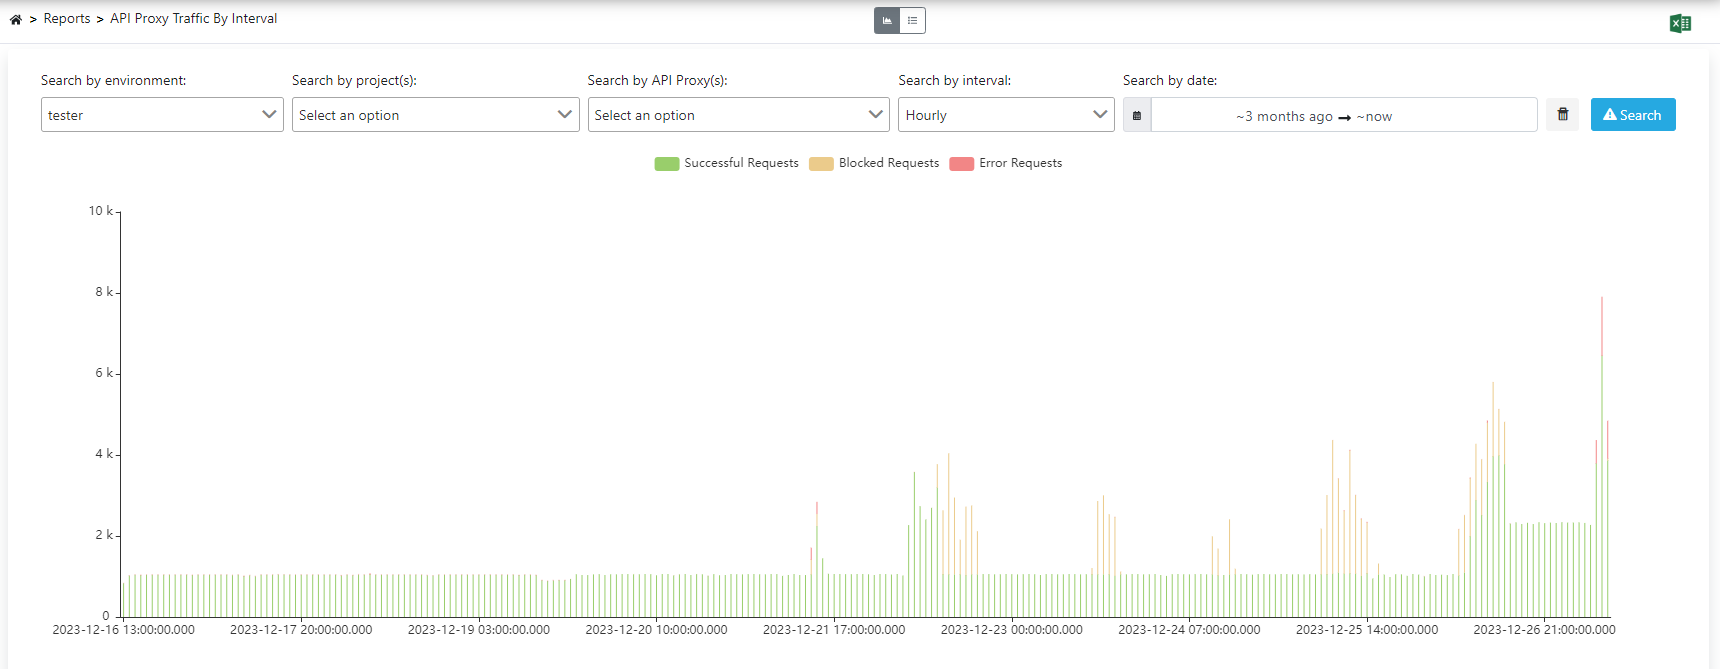
The picture below shows the graphic view screen:
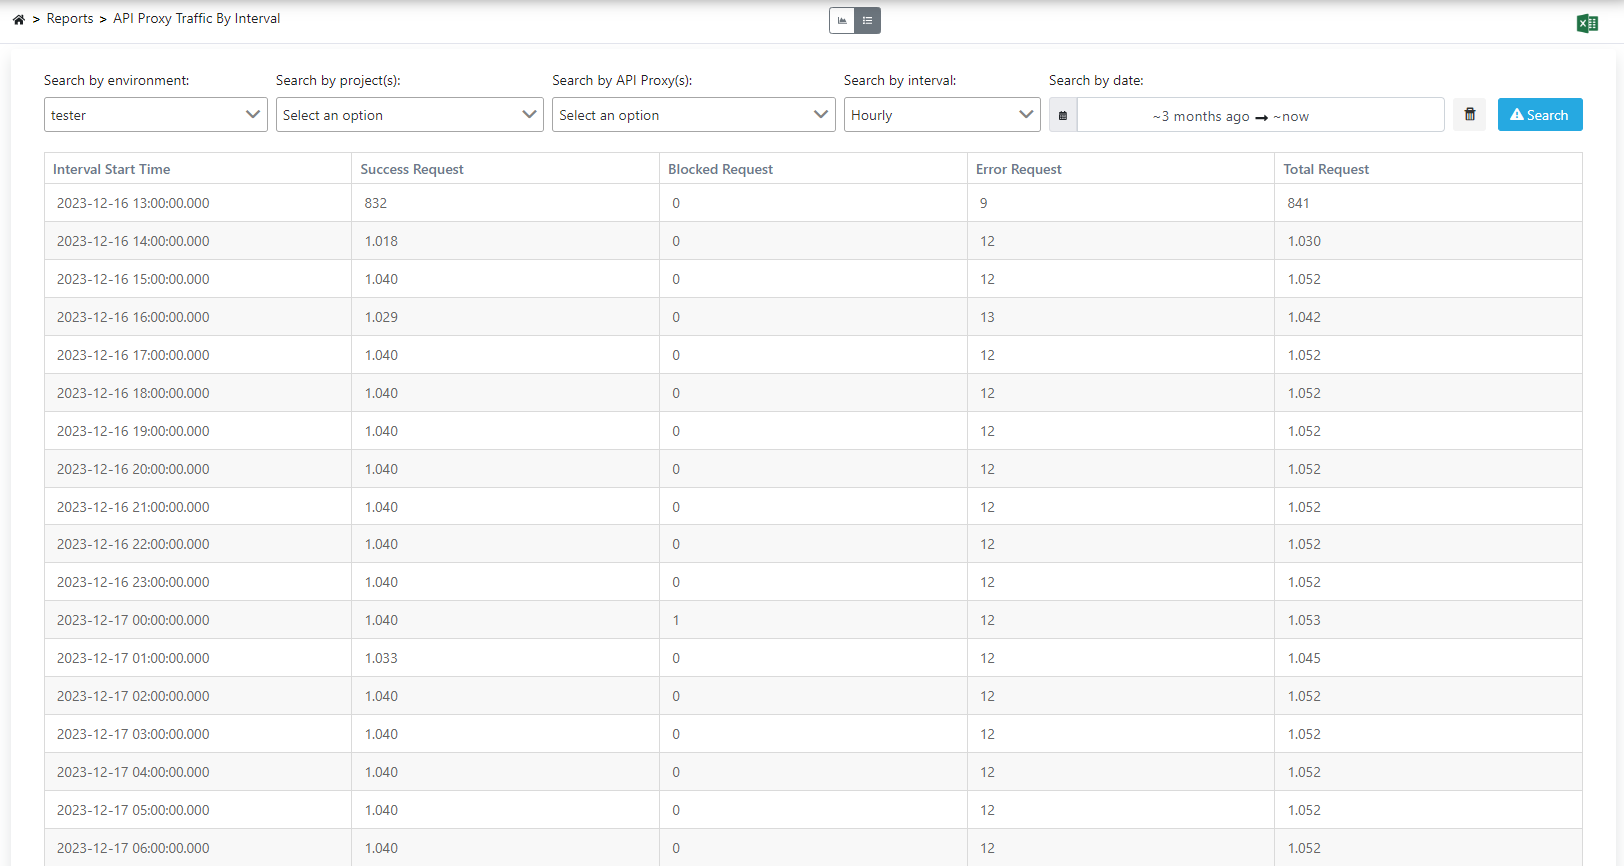
The picture below shows the tabular view screen:
Since Websocket and gRPC requests are kept as data coming to and leaving Apinizer, there are only 2 regions (incoming and outgoing) in this type of API Proxies.