Benchmark Results
SUMMARY
Thread Count: 2.000 Concurrent
Transactions: 15.000 reqs/sec
System Requirements: 1 Cpu 8 Core

Since these results will vary according to the response time of the called service, network delay, and the system requirements of the policies added on the gateway, you can review the details of our load test in the section below.
DETAILS
DigitalOcean platform was used as the infrastructure to run the load tests of the Apinizer platform because of its easy use and fast support.
The load test topology was as follows:
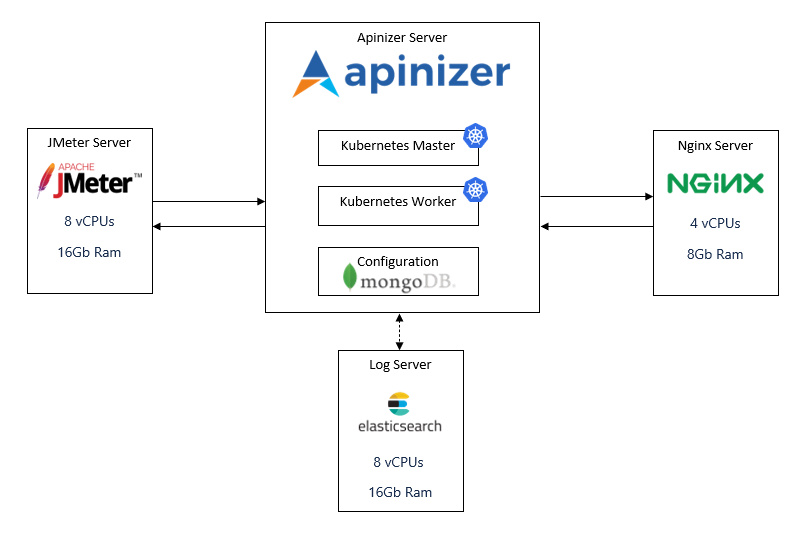
To create this topology and run our load tests, these steps were followed:
1. Setup of "Load Test Server" and Configuration of JMeter
Load Test Server specifications were:
- CPU-Optimized
- Dedicated CPU
- 8 vCPUs (Intel, second generation Xeon Scalable processors, 2.5 GHz)
- 16 GB Ram
- 100 GB Disk
- CentOS 8.3 x64
Following steps were done with root user
- Java 1.8 was installed
# yum install java-1.8.0-openjdk -y- Java version was ckecked
# java -version
openjdk version "1.8.0_275"
OpenJDK Runtime Environment (build 1.8.0_275-b01)
OpenJDK 64-Bit Server VM (build 25.275-b01, mixed mode)- "wget" command was installed for various file download operations
# yum install wget -y- Jmeter setup file was downloaded to server
# wget http://apache.stu.edu.tw//jmeter/binaries/apache-jmeter-5.2.1.tgz- Jmeter tar file was extracted
# tar -xf apache-jmeter-5.2.1.tgz- Environment in linux was configured for Jmeter
# vim ~/.bashrc- Following lines were added to .bashrc
export JMETER_HOME=/root/apache-jmeter-5.2.1
export PATH=$JMETER_HOME/bin:$PATH- The .bashrc file was reloaded with the source command
# source ~/.bashrcAfter configuration is completed, script for load testing was prepared using Jmeter's interface. The number of threads and load time were created as parametric values.
Sample JMeter configuration file:
<?xml version="1.0" encoding="UTF-8"?>
<jmeterTestPlan version="1.2" properties="5.0" jmeter="5.2">
  <hashTree>
    <TestPlan guiclass="TestPlanGui" testclass="TestPlan" testname="Test Plan" enabled="true">
      <stringProp name="TestPlan.comments"></stringProp>
      <boolProp name="TestPlan.functional_mode">false</boolProp>
      <boolProp name="TestPlan.tearDown_on_shutdown">true</boolProp>
      <boolProp name="TestPlan.serialize_threadgroups">false</boolProp>
      <elementProp name="TestPlan.user_defined_variables" elementType="Arguments" guiclass="ArgumentsPanel" testclass="Arguments" testname="User Defined Variables" enabled="true">
        <collectionProp name="Arguments.arguments"/>
      </elementProp>
      <stringProp name="TestPlan.user_define_classpath"></stringProp>
    </TestPlan>
    <hashTree>
      <ThreadGroup guiclass="ThreadGroupGui" testclass="ThreadGroup" testname="Thread Group" enabled="true">
        <stringProp name="ThreadGroup.on_sample_error">continue</stringProp>
        <elementProp name="ThreadGroup.main_controller" elementType="LoopController" guiclass="LoopControlPanel" testclass="LoopController" testname="Loop Controller" enabled="true">
          <boolProp name="LoopController.continue_forever">false</boolProp>
          <intProp name="LoopController.loops">-1</intProp>
        </elementProp>
        <stringProp name="ThreadGroup.num_threads">${__P(threads,10)}</stringProp>
        <stringProp name="ThreadGroup.ramp_time">5</stringProp>
        <boolProp name="ThreadGroup.scheduler">true</boolProp>
        <stringProp name="ThreadGroup.duration">${__P(seconds,30)}</stringProp>
        <stringProp name="ThreadGroup.delay"></stringProp>
        <boolProp name="ThreadGroup.same_user_on_next_iteration">true</boolProp>
      </ThreadGroup>
      <hashTree>
        <HTTPSamplerProxy guiclass="HttpTestSampleGui" testclass="HTTPSamplerProxy" testname="HTTP Request" enabled="true">
          <elementProp name="HTTPsampler.Arguments" elementType="Arguments" guiclass="HTTPArgumentsPanel" testclass="Arguments" testname="User Defined Variables" enabled="true">
            <collectionProp name="Arguments.arguments"/>
          </elementProp>
          <stringProp name="HTTPSampler.domain"><Change with Your IP></stringProp>
          <stringProp name="HTTPSampler.port">30080</stringProp>
          <stringProp name="HTTPSampler.protocol"></stringProp>
          <stringProp name="HTTPSampler.contentEncoding"></stringProp>
          <stringProp name="HTTPSampler.path">/apigateway/<Change with Your Path></stringProp>
          <stringProp name="HTTPSampler.method">GET</stringProp>
          <boolProp name="HTTPSampler.follow_redirects">true</boolProp>
          <boolProp name="HTTPSampler.auto_redirects">false</boolProp>
          <boolProp name="HTTPSampler.use_keepalive">true</boolProp>
          <boolProp name="HTTPSampler.DO_MULTIPART_POST">false</boolProp>
          <stringProp name="HTTPSampler.embedded_url_re"></stringProp>
          <stringProp name="HTTPSampler.connect_timeout"></stringProp>
          <stringProp name="HTTPSampler.response_timeout"></stringProp>
        </HTTPSamplerProxy>
        <hashTree>
          <ResultCollector guiclass="SummaryReport" testclass="ResultCollector" testname="Summary Report" enabled="true">
            <boolProp name="ResultCollector.error_logging">false</boolProp>
            <objProp>
              <name>saveConfig</name>
              <value class="SampleSaveConfiguration">
                <time>true</time>
                <latency>true</latency>
                <timestamp>true</timestamp>
                <success>true</success>
                <label>true</label>
                <code>true</code>
                <message>true</message>
                <threadName>true</threadName>
                <dataType>true</dataType>
                <encoding>false</encoding>
                <assertions>true</assertions>
                <subresults>true</subresults>
                <responseData>false</responseData>
                <samplerData>false</samplerData>
                <xml>false</xml>
                <fieldNames>true</fieldNames>
                <responseHeaders>false</responseHeaders>
                <requestHeaders>false</requestHeaders>
                <responseDataOnError>false</responseDataOnError>
                <saveAssertionResultsFailureMessage>true</saveAssertionResultsFailureMessage>
                <assertionsResultsToSave>0</assertionsResultsToSave>
                <bytes>true</bytes>
                <sentBytes>true</sentBytes>
                <url>true</url>
                <threadCounts>true</threadCounts>
                <idleTime>true</idleTime>
                <connectTime>true</connectTime>
              </value>
            </objProp>
            <stringProp name="filename"></stringProp>
          </ResultCollector>
          <hashTree/>
        </hashTree>
      </hashTree>
    </hashTree>
  </hashTree>
</jmeterTestPlan>
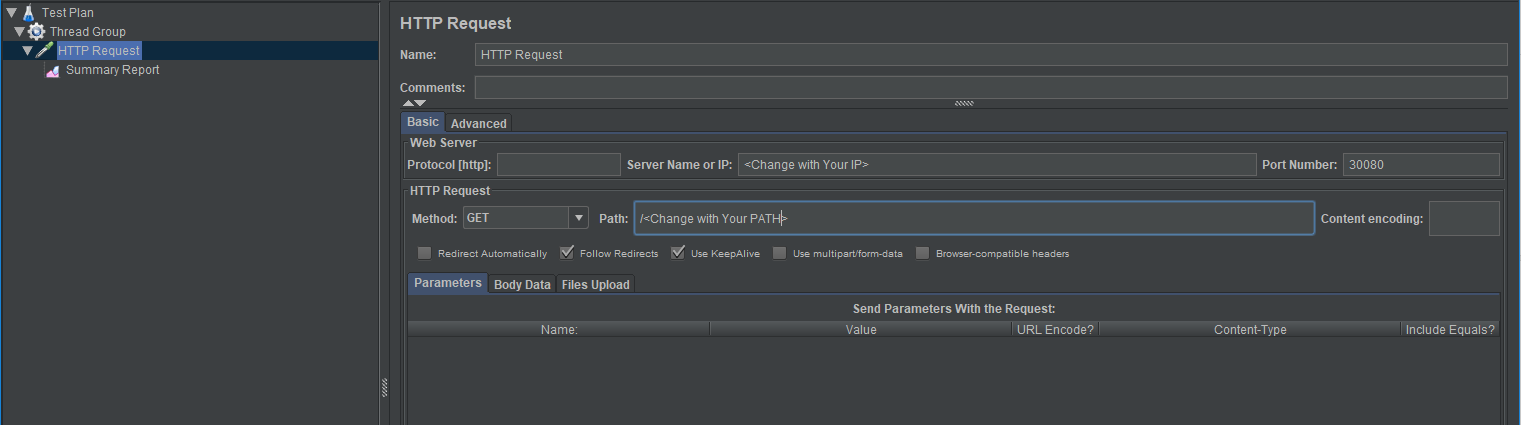
<Change with Your IP> value must be the IP address to which the load will be sent.
<Change with Your Path> value must be the request address following the IP address to which the load will be sent.
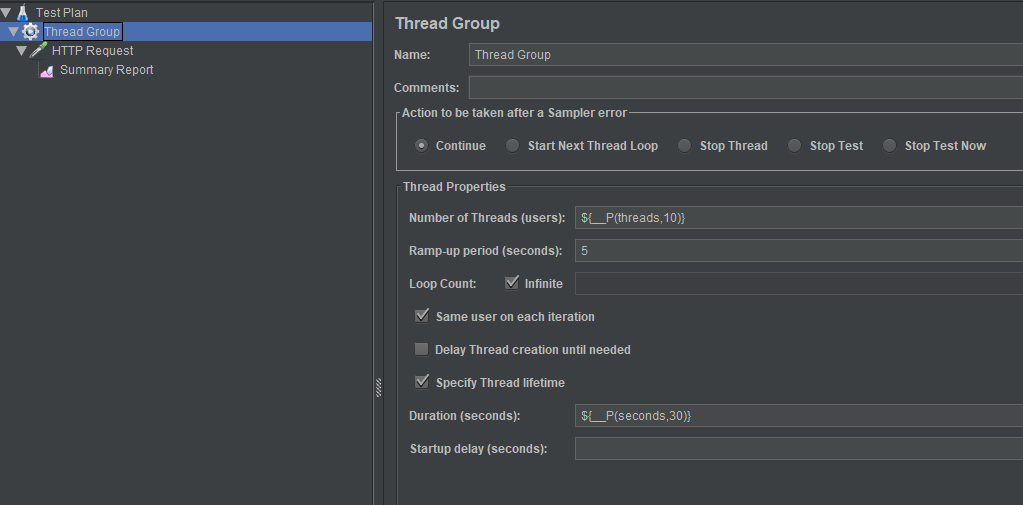
The "threads" and "seconds" values are parametric and will be given at runtime.
Screenshot of this configuration:
- Thread Group:
- HTTP Request:
- The following command was run by changing the thread and message duration, the results were recorded.
# jmeter -Jthreads=1000 -Jseconds=600 -n -t ./conf/configurable.jmx 2. Setup of "NGINX Server" and Configuration of NGINX
NGINX was used for simulating backend operations.
NGINX Server specifications were:
- CPU-Optimized
- Dedicated CPU
- 4 vCPUs (Intel, second generation Xeon Scalable processors, 2.5 GHz)
- 8 GB Ram
- 50 GB Disk
- CentOS 8.3 x64
Following steps were done with root user
- EPEL repository was installed
# yum install epel-release- NGINX was installed
# yum install nginx- NGINX was started after installation
# systemctl start nginx- To ensure that NGINX was working, accessed to the configured address from browser
http://server_domain_name_or_IP/- Enabled NGINX to run as a service in linux after successful result is seen
# systemctl enable nginx- Added/edited the following settings to the configuration file so that NGINX can run under high load
worker_processes 4;
worker_connections 8192;
worker_rlimit_nofile 40000;- NGINX's response body was set to 'OK' and statusCode is 200.
location / {
    return 200 'OK';
    add_header Content-Type text/plain;
}- NGINX configuration file after all configurations completed was as follows:
# vi /etc/nginx/nginx.conf

user nginx;
worker_processes 4;
worker_rlimit_nofile 40000;
error_log /var/log/nginx/error.log;
pid /run/nginx.pid;


include /usr/share/nginx/modules/*.conf;

events {
    worker_connections 8192;
}

http {
    log_format  main  '$remote_addr - $remote_user [$time_local] "$request" '
                      '$status $body_bytes_sent "$http_referer" '
                      '"$http_user_agent" "$http_x_forwarded_for"';

    access_log  /var/log/nginx/access.log  main;

    sendfile            on;
    tcp_nopush          on;
    tcp_nodelay         on;
    keepalive_timeout   65;
    types_hash_max_size 2048;

    include             /etc/nginx/mime.types;
    default_type        application/octet-stream;

    include /etc/nginx/conf.d/*.conf;

    server {
        listen       80 default_server;
        listen       [::]:80 default_server;
        server_name  _;
        root         /usr/share/nginx/html;


        include /etc/nginx/default.d/*.conf;

        location / {
            return 200 'OK';
            add_header Content-Type text/plain;
        }

        error_page 404 /404.html;
            location = /40x.html {
        }

        error_page 500 502 503 504 /50x.html;
            location = /50x.html {
        }
    }

}- NGINX updated configuration was reloaded by the following command:
# nginx -s reload- To ensure NGINX loads the latest settings, accessed server address from browser and 'OK' text was seen.
3. Setup of "Apinizer and Log Server" and Kubernetes, MongoDb, ElasticSearch
Kubernetes master and mongodb server specification:
- CPU-Optimized
- Dedicated CPU
- 4 vCPUs (Intel, second generation Xeon Scalable processors, 2.5 GHz)
- 8 GB Ram
- 50 GB Disk
- CentOS 8.3 x64
Kubernetes worker server specification:- CPU-Optimized
- Dedicated CPU
- 16 vCPUs (Intel, second generation Xeon Scalable processors, 2.5 GHz)
- 32 GB Ram
- 200 GB Disk
- CentOS 8.3 x64
Log database (Elasticsearch) server specification:- CPU-Optimized
- Dedicated CPU
- 8 vCPUs (Intel, second generation Xeon Scalable processors, 2.5 GHz)
- 16 GB Ram
- 100 GB Disk
- CentOS 8.3 x64
In this section, installation of kubernetes master, worker, mongodb, elasticsearch and Apinizer were done as steps detailed in https://docs.apinizer.com/
4. Key Points of Load Test
Points to consider while testing:
- Apinizer asynchronously stores all request and response messages and metrics in the Elasticsearch log database. During the tests, this logging operations continued as it was to be.
- In all our tests, we used internal IPs to reduce network latency and see the real impact of Apinizer.
- We specifically observed that Kubernetes does not restart pods during runtime. The number of restarts is an important parameter as it reflects the overload/stuffing or faulty conditions.
- These 4 configurations were setup from Gateway Environments and Elasticsearch Clusters screens, and used in tests:
| Worker Settings | Routing Connection Pool | Elastic Search Client | ||||||||
| Core | Ram (gb) | IO Threads | Min. Thread Count | Max. Thread Count | Http Max Connections | Max Conn. Per Route | Max Conn. Total | IO Thread Count | Max Conn. Per Route | Max Conn. Total |
| 1 | 1 | 1 | 512 | 1024 | 1024 | 512 | 1024 | 4 | 32 | 64 |
| 2 | 2 | 2 | 1024 | 2048 | 4096 | 2048 | 4096 | 16 | 64 | 128 |
| 4 | 4 | 4 | 1024 | 4096 | 8192 | 4096 | 8192 | 32 | 64 | 128 |
| 8 | 8 | 16 | 1024 | 8192 | 8192 | 4096 | 8192 | 32 | 128 | 256 |
- Following values were added to the jvm parameters: -server -XX:MaxRAMPercentage=90
- These 4 cases above were tested with Get and Post requests. 5K and 50K request bodies were used for the Post requests.
- All the test cases were done for 10 minutes.
5. Monitoring System Resources
Since Apinizer works in the kubernetes environment, two methods were preferred to monitor the resources spent. These were:
- Kubernetes dashboard, the setup of which is described on this page,
- JConsole
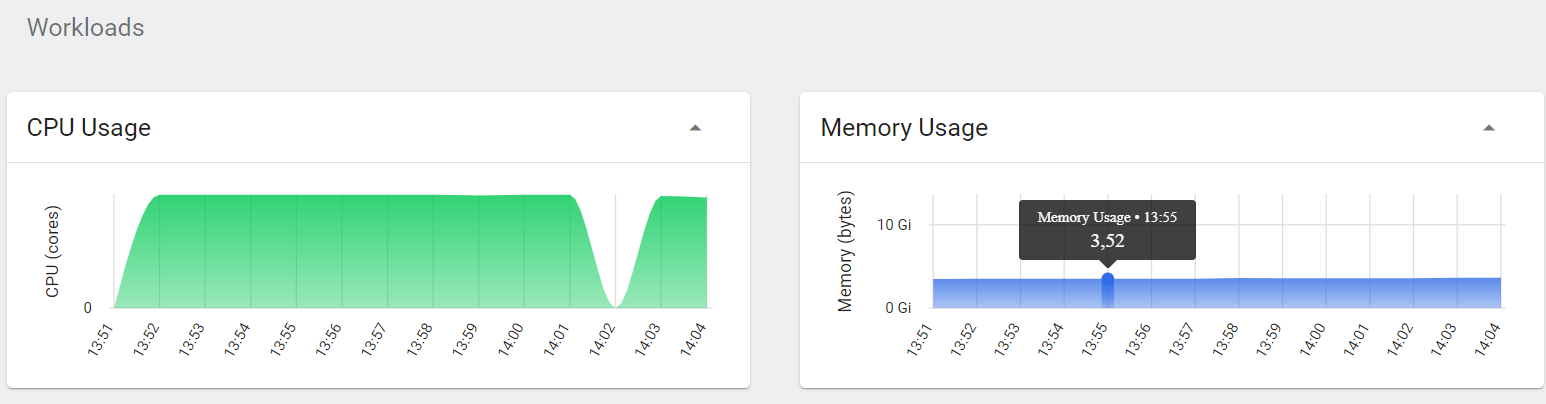
Monitoring resources via Kubernetes Dashboard was relatively easy, giving instantaneous CPU and RAM status of the server.
However, the drawback of this method was that it was not able to monitor the sources in the long term and did not show the details:
For this reason, the use of JConsole became more useful.
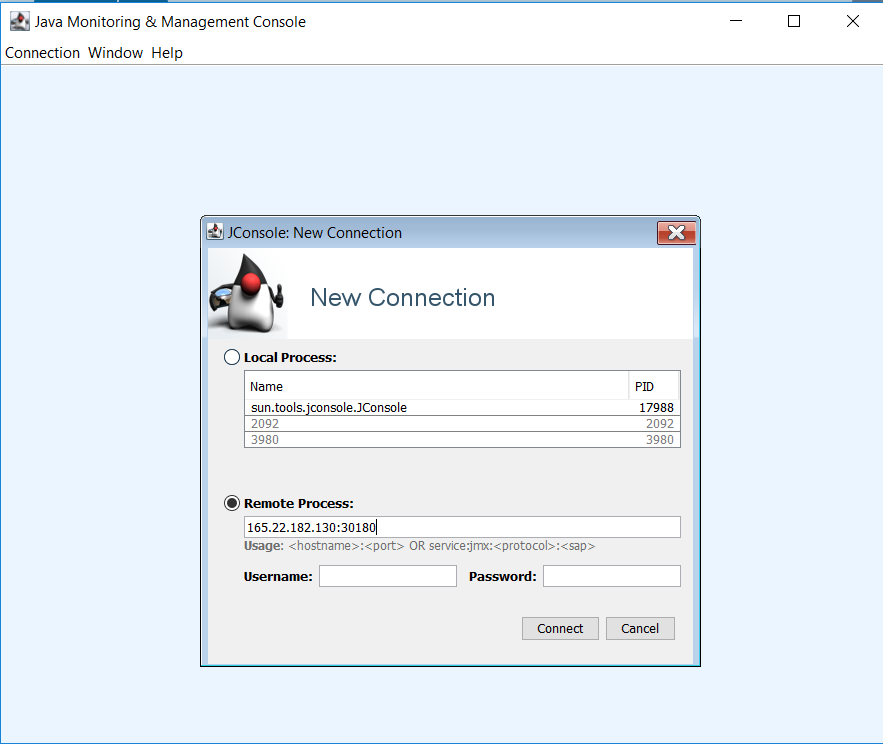
These below settings have been made so that the JConsole application can access the Java application running inside the Pod in kubernetes:
- The Java startup parameters were set as follows:
-Dcom.sun.management.jmxremote -Dcom.sun.management.jmxremote.port=30180 -Dcom.sun.management.jmxremote.rmi.port=30180 -Dcom.sun.management.jmxremote.local.only=false -Dcom.sun.management.jmxremote.authenticate=false -Dcom.sun.management.jmxremote.ssl=false -Djava.rmi.server.hostname=<WorkerServersExternalAccessIP>- In order to open the JMX service, which is opened from the 30180 port of the Worker pod, to the internet, the following service definition has been made in kubernetes:
apiVersion: v1
kind: Service
metadata:
  name: worker-jmx-service
  namespace: prod
  labels:
    app: worker
spec:
  selector:
    app: worker
  type: NodePort
  ports:
    - name: http
      port: 30180
      targetPort: 30180
nodePort: 30180When the settings are finished, the JConsole application was run and accessed to the JVM running on the worker was provided by giving the external access address of the worker server and port 30180.
6. Results
| GET | POST 5Kb | POST 50Kb | |||||
| No | Thread Count | Throughput | Avg | Throughput | Avg | Throughput | Avg |
| A | 50 | 1133 | 43 | 1002 | 49 | 675 | 73 |
| 100 | 1100 | 90 | 983 | 101 | 653 | 152 | |
| 250 | 1025 | 242 | 852 | 292 | 554 | 448 | |
| 500 | 963 | 516 | - | - | - | - | |
| B | 50 | 2232 | 22 | 1868 | 26 | 1437 | 34 |
| 100 | 2169 | 45 | 1768 | 56 | 1409 | 70 | |
| 250 | 2089 | 119 | 1456 | 170 | 1223 | 203 | |
| 500 | 1915 | 259 | 1398 | 355 | 1149 | 432 | |
| 1000 | 1762 | 564 | 1229 | 809 | 877 | 1134 | |
| 1500 | 1631 | 915 | 1199 | 1245 | - | - | |
| 2000 | 1379 | 1441 | - | - | - | - | |
| C | 50 | 8090 | 6 | 7353 | 6 | 4679 | 10 |
| 100 | 7816 | 12 | 7257 | 13 | 4675 | 21 | |
| 250 | 7011 | 35 | 7138 | 34 | 4020 | 61 | |
| 500 | 6759 | 73 | 7141 | 69 | 3221 | 154 | |
| 1000 | 6742 | 147 | 7011 | 141 | 2962 | 335 | |
| 1500 | 6683 | 223 | 6935 | 215 | - | - | |
| 2000 | 6692 | 297 | - | - | - | - | |
| 4000 | 6448 | 617 | - | - | - | - | |
| D | 50 | 15420 | 3 | 13396 | 3 | 4683 | 10 |
| 100 | 15812 | 6 | 13482 | 7 | 4671 | 21 | |
| 250 | 15614 | 15 | 13587 | 18 | 4382 | 56 | |
| 500 | 15664 | 31 | 13611 | 36 | 3496 | 142 | |
| 1000 | 15454 | 64 | 13562 | 73 | 3046 | 326 | |
| 1500 | 15026 | 99 | 13208 | 112 | 2853 | 522 | |
| 2000 | 14839 | 133 | 13179 | 150 | 2794 | 710 | |
| 4000 | 14356 | 276 | 12792 | 309 | - | - | |
| 8000 | 11603 | 655 | 11115 | 701 | - | - | |
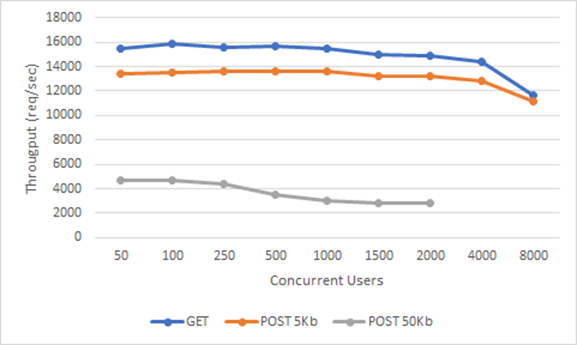
Throughput & Concurrent Users

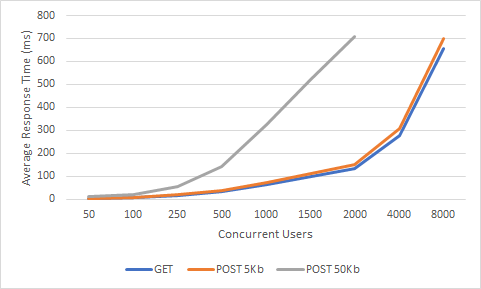
Average Response Time & Concurrent Users
Key observations:
A very common mistake when examining the results is to confuse the number of sessions with the number of instant requests. A request is an HTTP request for a specific destination with a specific HTTP method. There can be zero or more requests per session. For example, having 50K sessions in a web application does not mean that the instant request will be 50K, but the probability of 50K requests at the same time is very low. Keeping and using session on gateways is very rare, usually access to backend services is stateless. Therefore, it becomes more meaningful to measure the number of simultaneous requests and latency.
When the number of concurrent users increases, the efficiency increases up to a certain limit. Then it starts to decline. In fact, this natural course indicates that there is a limit to vertical growth. To support more concurrent users with acceptable response times, horizontal and vertical scaling must be considered together. While scaling horizontally, it is necessary to put a load balancer in front of two or more gateways in other gateways, while this process can be configured very easily and quickly since Kubernetes infrastructure is used in Apinizer.
As the message sizes increase, the power needed for processing will increase and the efficiency will decrease. Therefore, the response time is become longer. Although the request sizes are usually around 1Kb in real-life scenarios, we found it worth examining 5Kb and 50Kb Post requests as there was little difference between our 1Kb Post and Get requests in our tests. Although the results are naturally lower than the GET requests, we were pleased that the figures dropped to only one fourth of the performance, which increased by 10 times.
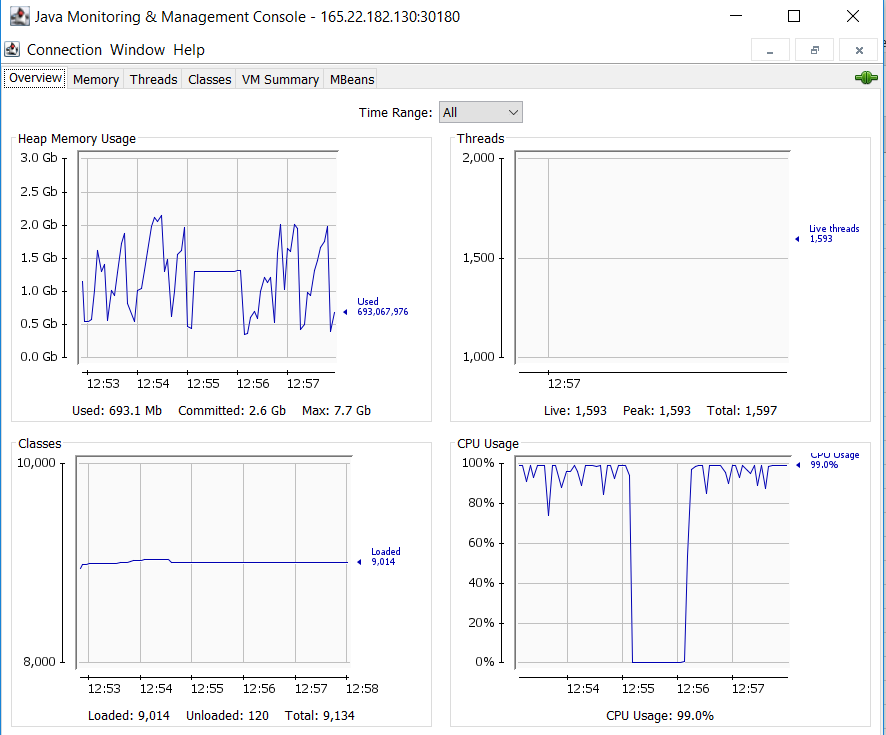
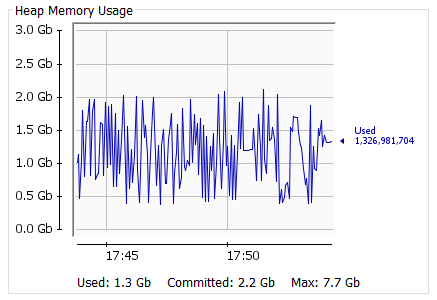
Ram expended rates were very consistent throughout the load test. Although the size of the requests increased tenfold, there was no significant increase in RAM usage. This proved that Openj9 was the right choice for Apinizer.
State "D", 8000 Thread, a snapshot of the VM for the Get request:
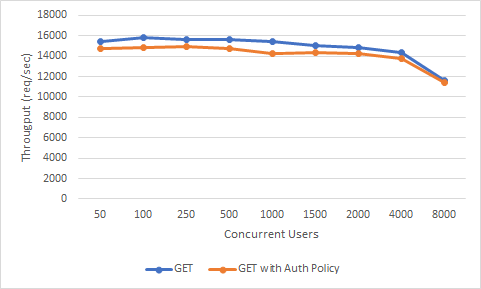
Effect of adding a Policy
Each policy we add to the gateway affects performance on the gateway according to its complexity and dependencies.
Now let's add a "basic authentication" policy to Apinizer. Let's test this configuration only for case "D", not all cases, it should give us an idea after all:
| GET | GET with Policy | ||||
| No | Thread Count | Throughput | Avg | Throughput | Avg |
| D | 50 | 15420 | 3 | 14760 | 3 |
| 100 | 15812 | 6 | 14843 | 6 | |
| 250 | 15614 | 15 | 14891 | 16 | |
| 500 | 15664 | 31 | 14748 | 33 | |
| 1000 | 15454 | 64 | 14285 | 68 | |
| 1500 | 15026 | 99 | 14373 | 102 | |
| 2000 | 14839 | 133 | 14280 | 136 | |
| 4000 | 14356 | 276 | 13795 | 279 | |
| 8000 | 11603 | 655 | 11437 | 672 | |
Throughput & Concurrent Users
Average Response Time & Concurrent Users
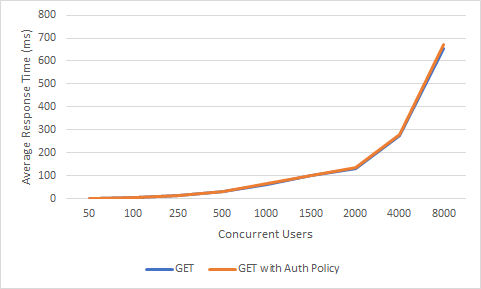
As we can see, the effect on the performance has been insignificant. But if, for example, a policy with high processing power such as "content filtering" was added, or a policy such as "Ldap Authentication" that requires external connection and adds network latency, performance would decrease even more rapidly. The important thing here is to know how much burden each policy will bring and to choose the design accordingly.