Geographic Visualization of Requests to Apinizer with Kibana Maps
In this document, we will explain how to visualize the geolocation data used in Apinizer on the map with the Kibana Maps feature.
You can use the geolocation feature in Apinizer with the 2025 version. Please see the related document to use the geolocation feature.
1) Geolocation Data Provided via Apinizer
The geolocation data of the incoming request in Apinizer is represented in Elasticsearch in a JSON format as follows.
{
  "toClientBody": "[]",
  "loc": {
    "lat": 41.0,
    "lon": 28.0
  }
}Latitude and longitude are geographic coordinates used to determine the position of a point on Earth.
For example:
- Latitude: 41.0082° N, Longitude: 28.9784° E (Istanbul, Turkey)
- Latitude: 40.7128° N, Longitude: 74.0060° W (New York, USA)
2) Transferring Data to Kibana
2.1) Creating Index Pattern
In the step of data transfer to Kibana, Kibana installation and integration must be ensured. Please see the related document for Kibana installation.
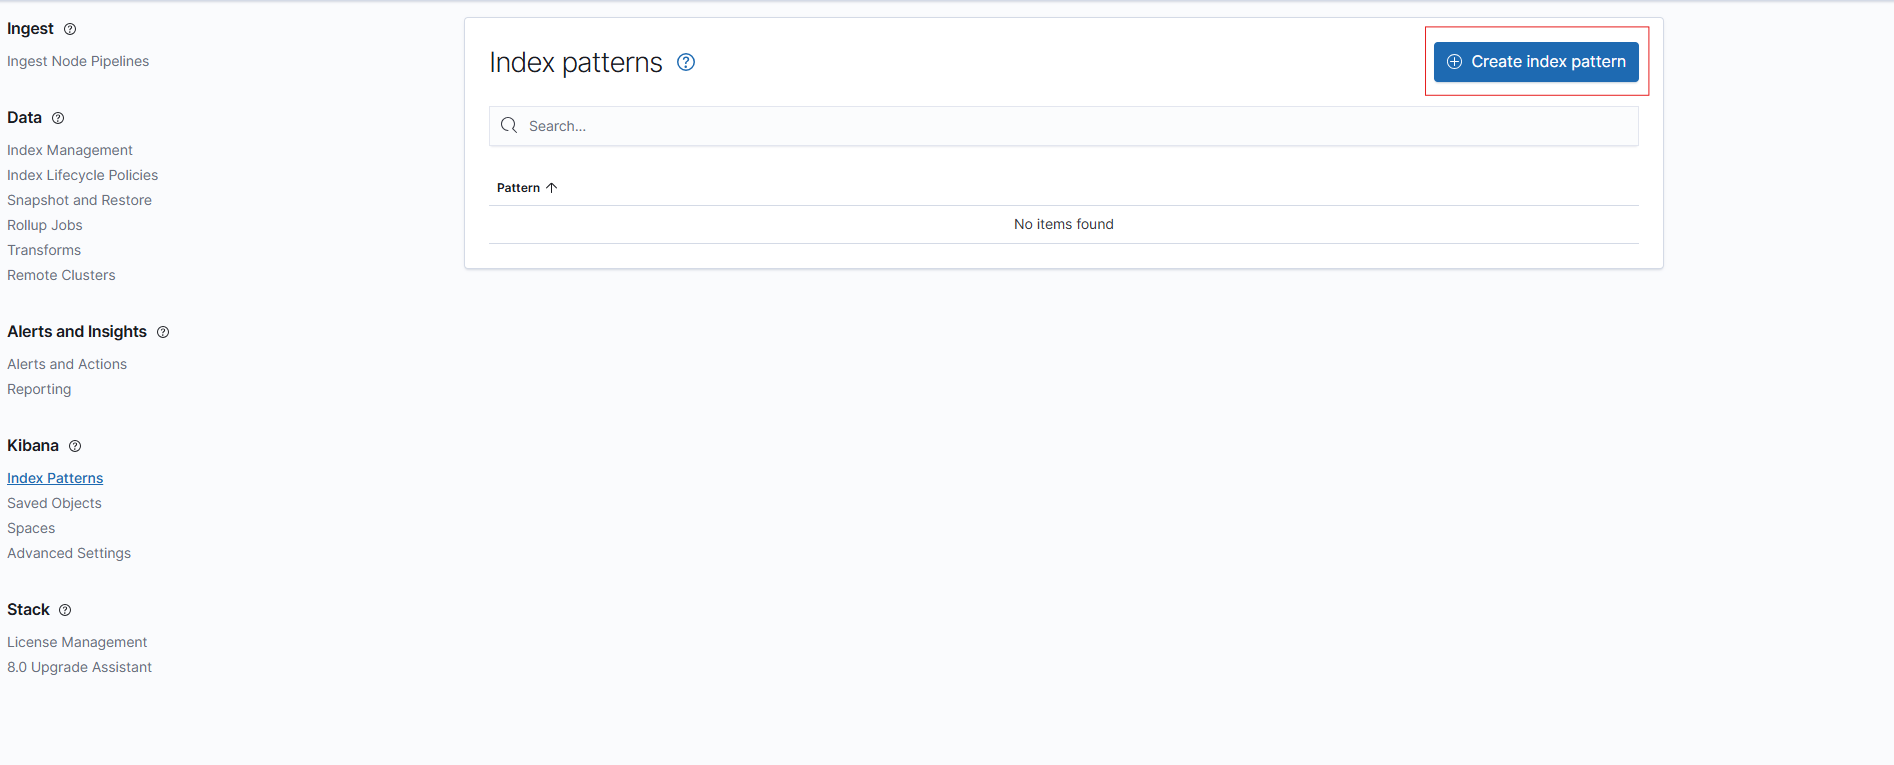
After installation, in Kibana, on the Stack Management → Index Patterns page, a new index pattern can be created from the 'Create Index Pattern' section:
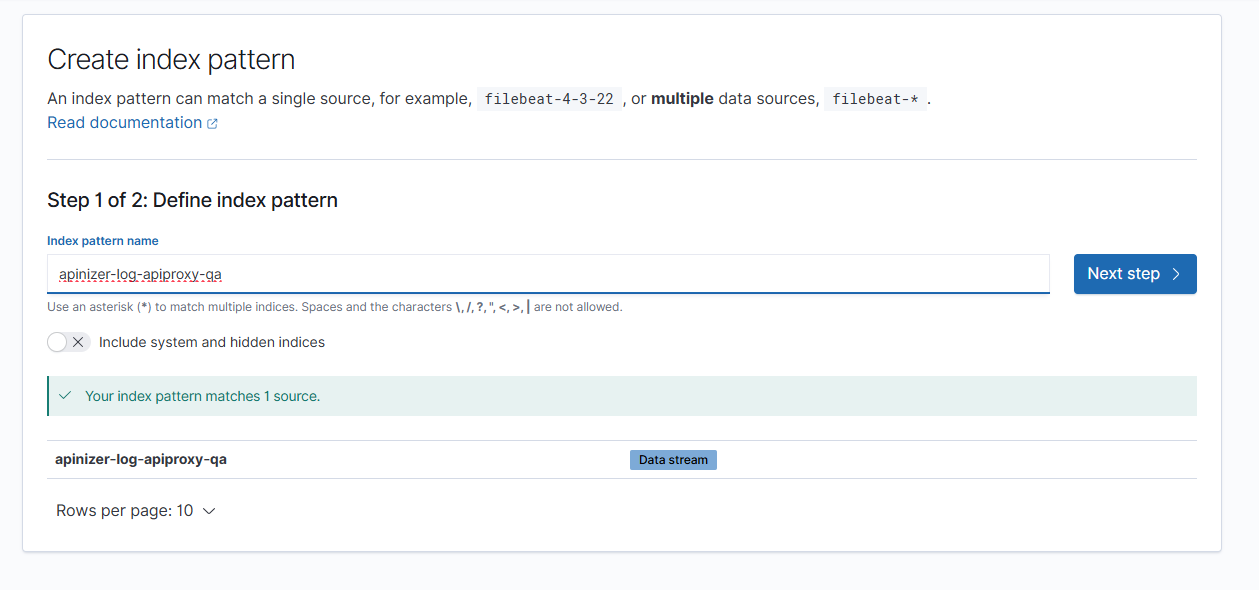
The steps are completed by selecting the data stream used in Elasticsearch and the creation process is completed:
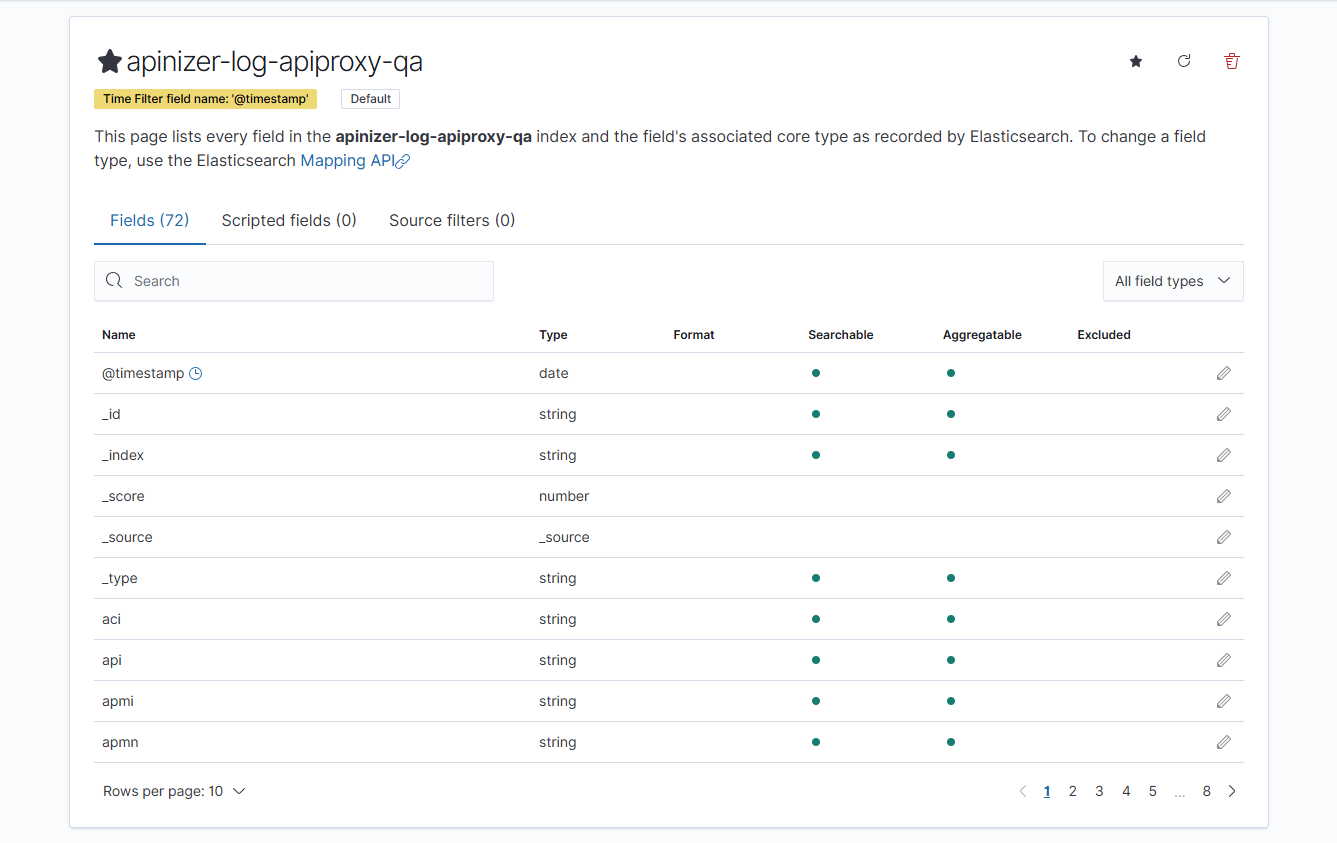
Once the creation process is complete, you can see the relevant fields on the following page:
2.2) Checking the Current Index Pattern
If Kibana has already been installed and the index pattern exists, refresh the index you added to Kibana from the Stack Management →Index Patterns page below. You should check that the relevant value exists by typing 'loc' in the search field.
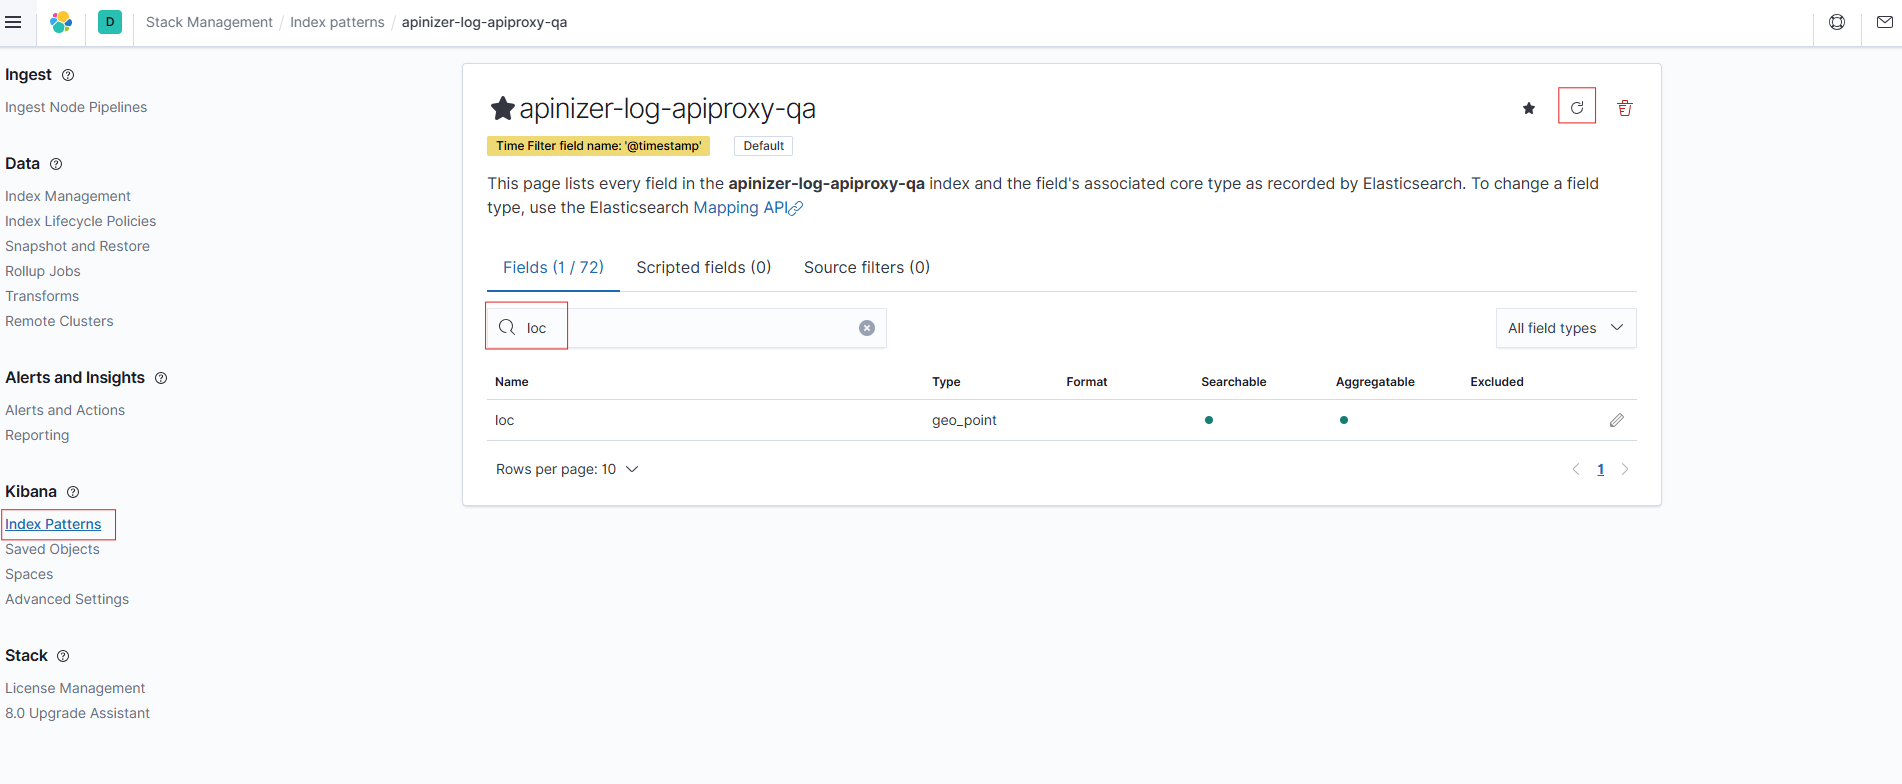
Kibana uses this 'loc' data (latitude and longitude) to visualize incoming requests on a map.
3) Adding and Visualizing Map Panel with Kibana Maps
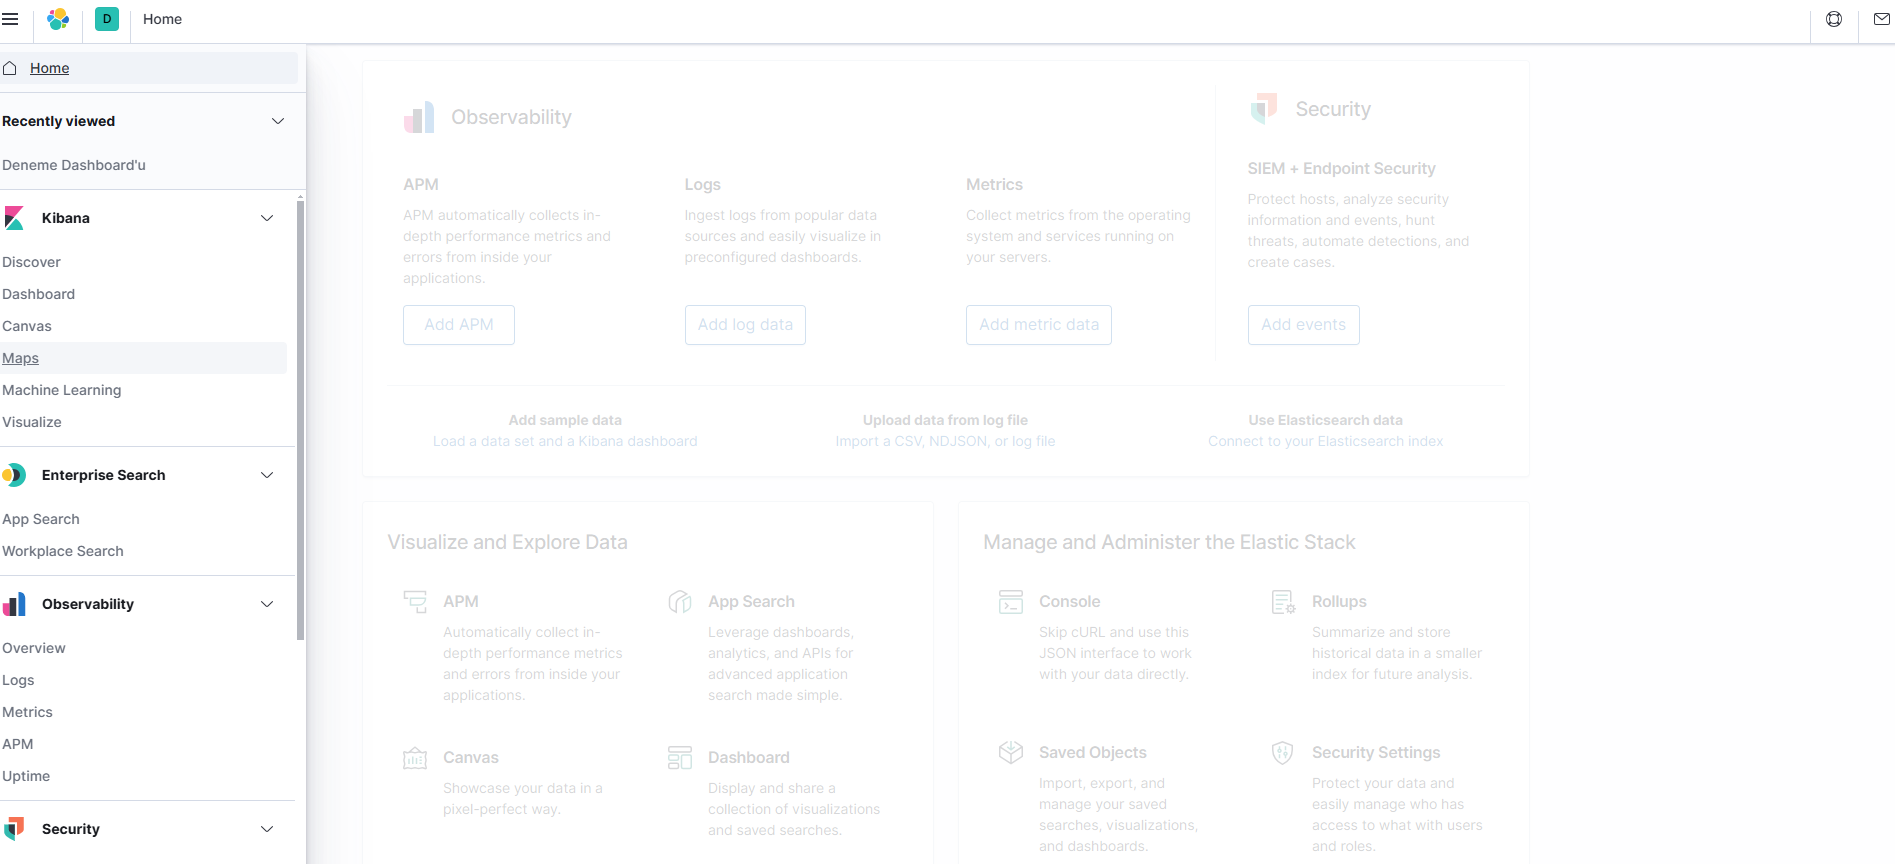
On the Kibana homepage, click on the “Maps” tab in the left menu. This is the application you will use to create map visualizations:
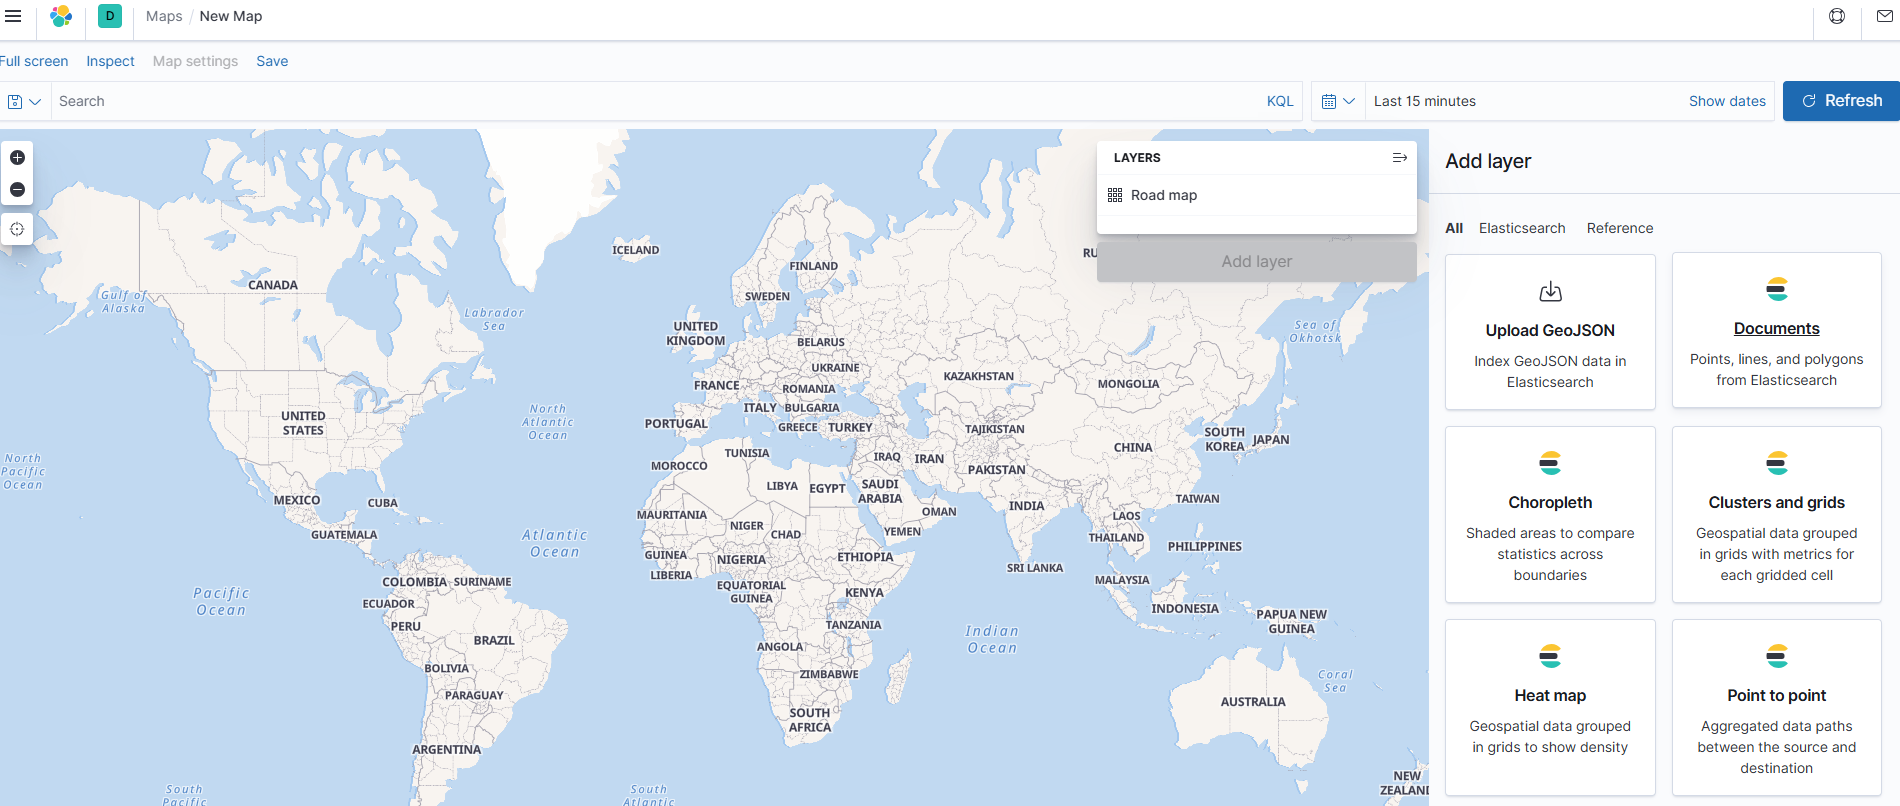
Click on the Add layer button. Select the Documents option:
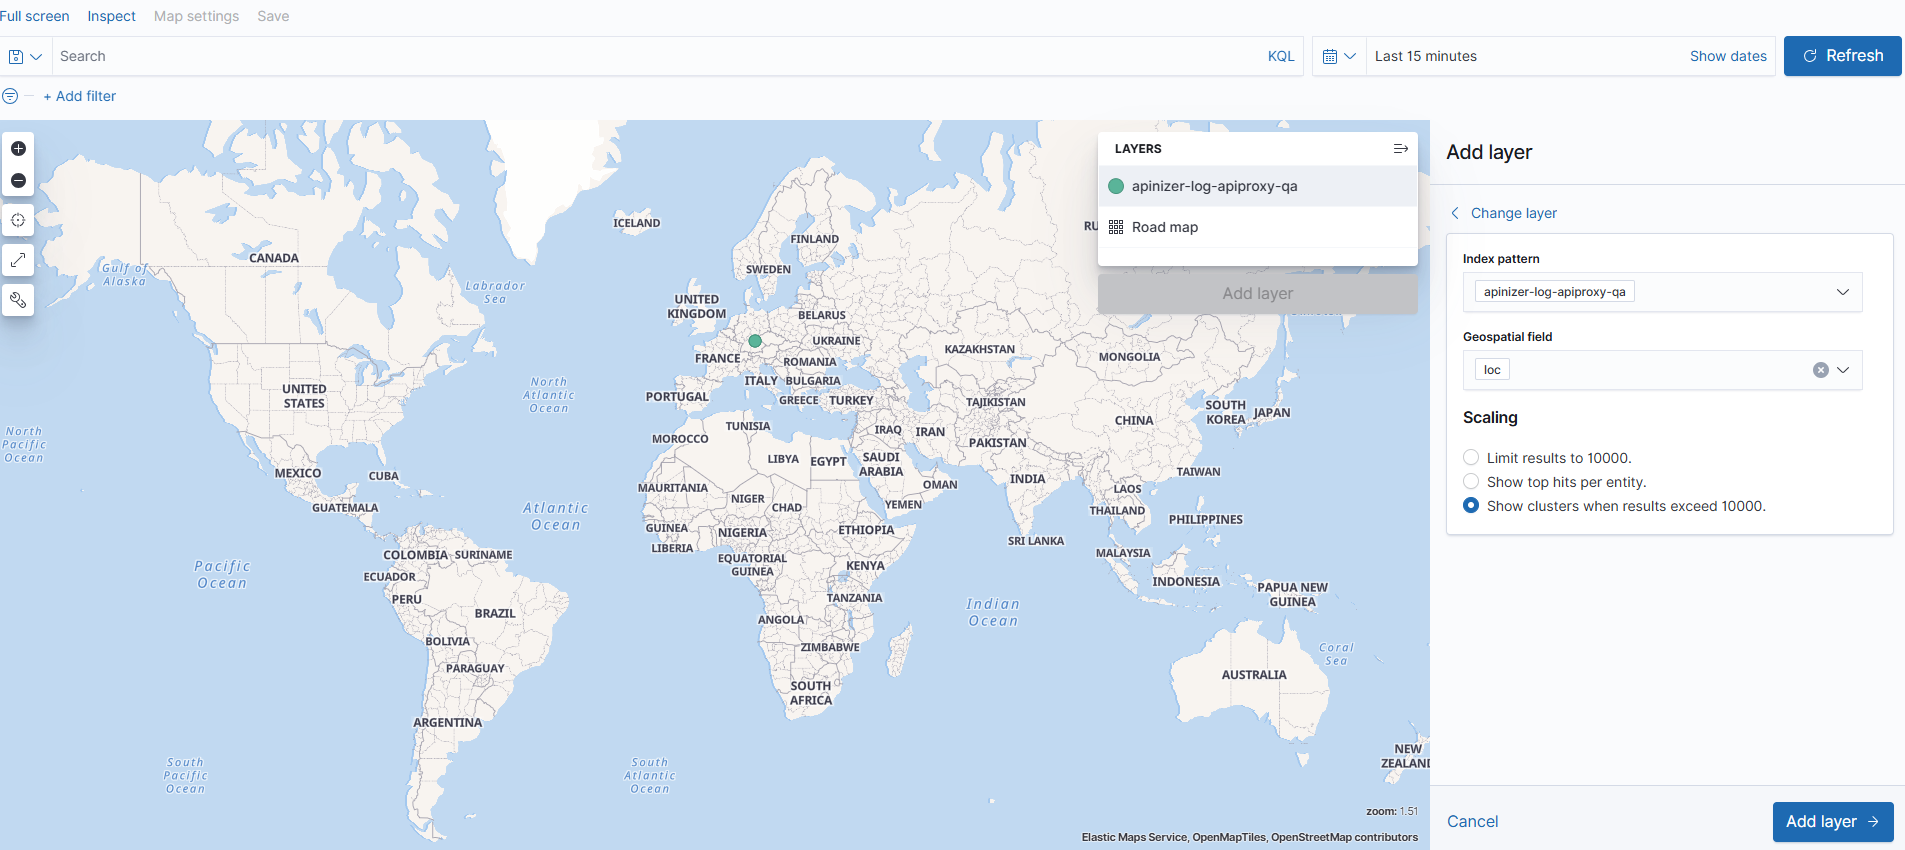
After selecting the index pattern, the 'loc' field will be automatically selected. You can then click on the 'Add layer' button to add the layer and save it with a name:
4) Result
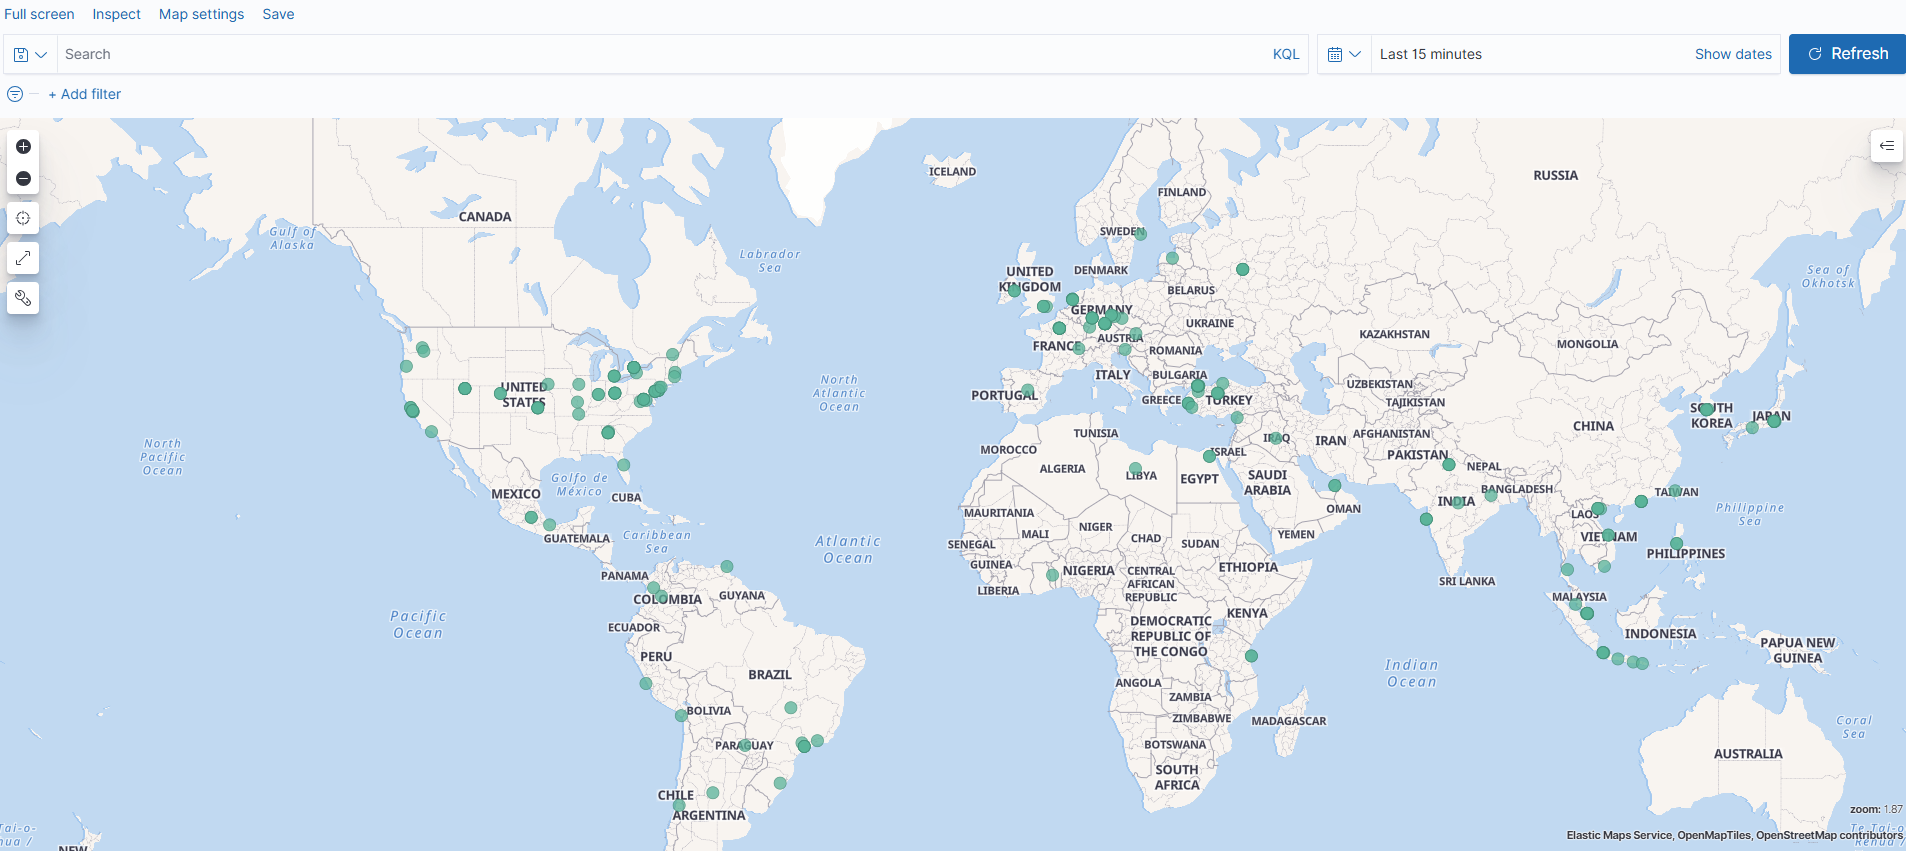
In this document, after the IP information of the incoming requests to Apinizer is converted into geographic data and sent to Elasticsearch, it is visualized step by step from which cities the requests come from using Kibana Maps.
Thanks to this structure, user access can be analyzed on a city basis.
Requests received on the map will be indicated by green markers: