Prometheus Installation and Scraping Configuration for Apinizer Gateway
Prometheus Installation and Scraping Configuration
Prometheus is a monitoring system that pulls metrics from specific targets and stores them as time series data. Scraping is the process by which Prometheus periodically collects metrics from target services. The Apinizer Gateway's metrics are provided through port 9091 and Prometheus can pull these metrics in two different ways:
Constant Scraping:
In static scraping, the services to be monitored are defined under static_configs with predefined fixed IP addresses or DNS names. Prometheus queries these services at regular intervals. This method is useful when service addresses do not change or can be defined manually.Dynamic Scraping:
In dynamic scraping, Prometheus automatically discovers services through a service discovery mechanism such as Kubernetes. With kubernetes_sd_config or similar configurations, there is no need to update the Prometheus configuration as services change. This is a great advantage in microservice architectures and constantly changing infrastructures.
These two methods are preferred according to the use case, allowing Prometheus to pull metrics from Apinizer Gateway.
Constant Scraping Configuration:
In order for the Apinizer Gateway to broadcast metrics over port 9091, the relevant container must be given -name as environment variable: METRICS_ENABLED=TRUE parameter must be defined.
...
containers:
- env:
  - name: METRICS_ENABLED
    value: "true"
...In the Constant Scraping configuration, the service name from which Prometheus will scrape the metrics must be specified. For this reason, a service should be created to forward to port 9091 of the Apinizer Worker component.
apinizer-prometheus-svc.yaml
apiVersion: v1
kind: Service
metadata:
  name: worker-prometheus-service
  namespace: <WORKER_NAMESPACE>
spec:
  ports:
    - port: 9091
      protocol: TCP
      targetPort: 9091
  selector:
    app: worker
  type: ClusterIP
In order for Apinizer Gateway to provide metrics to Prometheus on port 9091, the scraping configuration of Prometheus must be done via ConfigMap. Prometheus' worker-prometheus-service is defined in static_configs at the specified address and constant scraping configuration is performed.
apiVersion: v1
kind: Namespace
metadata:
  name: monitoring
---
apiVersion: v1
kind: ConfigMap
metadata:
  name: prometheus-config
  namespace: monitoring
data:
  prometheus.yml: |
    global:
      scrape_interval: 15s

    scrape_configs:
      - job_name: 'my-app-static'
        static_configs:
- targets: ['worker-prometheus-service.<WORKER_NAMESPACE>.svc.cluster.local:9091']Dynamic Scraping Configuration:
The dynamic scraping method allows Prometheus to automatically discover pods within Kubernetes. Thanks to this method, there is no need to configure manual scraping for each new pod. Prometheus automatically pulls metrics using specific annotations attached to pods.
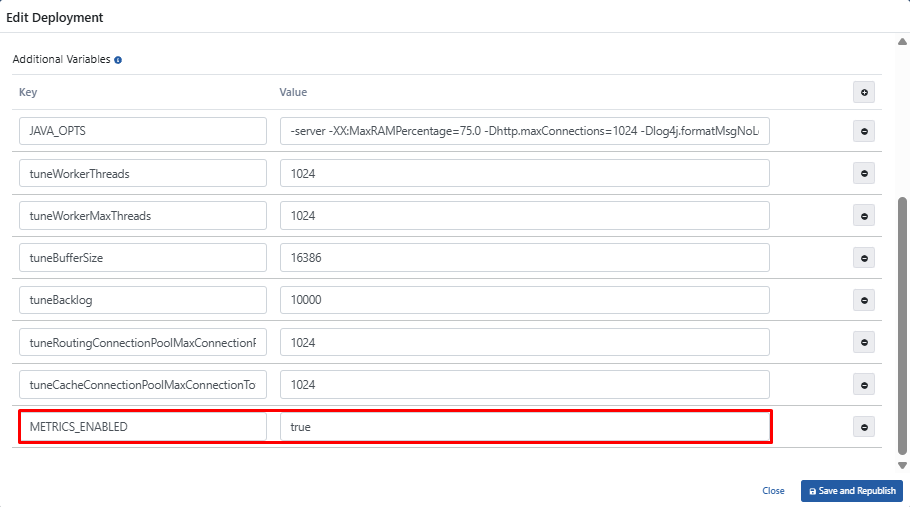
In order for Gateway metrics to be collected by Prometheus, the METRICS_ENABLED=TRUE variable must be added by selecting the Worker edit deployment option in the Deployments & Services section on the Gateway Environments page.
If Kubernetes management is not done with Apinizer
In order to enable Prometheus to collect metrics from Worker pods, relevant annotations should be added to the spec.template.metadata.annotations section of the relevant Deployment manifest. In addition, in order for Apinizer Gateway to be able to broadcast metrics over port 9091, environment variable -name: METRICS_ENABLED=TRUE parameter must be defined. In this way, the metrics service will be exported over port 9091 and Prometheus will automatically discover the Apinizer Gateway pod running on port 9091 and scrape the metrics.
...
template:
    metadata:
      annotations:
        prometheus.io/port: "9091"
        prometheus.io/scrape: "true"
......
containers:
- env:
- name: METRICS_ENABLED
value: "true"
...Prometheus Scraping Configuration
Dynamic scraping must be enabled in Prometheus' ConfigMap configuration using kubernetes_sd_configs to discover anotations in pods.
The following ConfigMap example enables Prometheus to dynamically discover Kubernetes pods: This configuration allows Prometheus to automatically discover Kubernetes pods and collect metrics only from pods with the anotation prometheus.io/scrape: “true”. Thus, by applying dynamic scraping to Apinizer Gateway, metrics can be collected by Prometheus without the need for manual target definition.
apiVersion: v1
kind: ConfigMap
metadata:
  name: prometheus-config
  namespace: monitoring
data:
  prometheus.yml: |
    global:
      scrape_interval: 15s

    scrape_configs:
      - job_name: 'kubernetes-pods'
        honor_labels: true
        kubernetes_sd_configs:
          - role: pod
        relabel_configs:
          - source_labels: [__meta_kubernetes_pod_annotation_prometheus_io_scrape]
            action: keep
            regex: true
          - source_labels: [__meta_kubernetes_pod_annotation_prometheus_io_scrape_slow]
            action: drop
            regex: true
          - source_labels: [__meta_kubernetes_pod_annotation_prometheus_io_scheme]
            action: replace
            regex: (https?)
            target_label: __scheme__
          - source_labels: [__meta_kubernetes_pod_annotation_prometheus_io_path]
            action: replace
            target_label: __metrics_path__
            regex: (.+)
          - source_labels: [__meta_kubernetes_pod_annotation_prometheus_io_port, __meta_kubernetes_pod_ip]
            action: replace
            regex: (\d+);(([A-Fa-f0-9]{1,4}::?){1,7}[A-Fa-f0-9]{1,4})
            replacement: '[$2]:$1'
            target_label: __address__
          - source_labels: [__meta_kubernetes_pod_annotation_prometheus_io_port, __meta_kubernetes_pod_ip]
            action: replace
            regex: (\d+);((([0-9]+?)(\.|$)){4})
            replacement: $2:$1
            target_label: __address__
          - action: labelmap
            regex: __meta_kubernetes_pod_annotation_prometheus_io_param_(.+)
            replacement: __param_$1
          - action: labelmap
            regex: __meta_kubernetes_pod_label_(.+)
          - source_labels: [__meta_kubernetes_namespace]
            action: replace
            target_label: namespace
          - source_labels: [__meta_kubernetes_pod_name]
            action: replace
            target_label: pod
          - source_labels: [__meta_kubernetes_pod_phase]
            regex: Pending|Succeeded|Failed|Completed
            action: drop
          - source_labels: [__meta_kubernetes_pod_node_name]
            action: replace
target_label: nodeInstallation of Prometheus
Persistent Storage Configuration
Since Prometheus' metrics will be stored on a node in the Kubernetes cluster, PersistentVolume (PV) and PersistentVolumeClaim (PVC) definitions are required. This configuration allows Prometheus to protect its data in case of shutdown or restart.
apiVersion: v1
kind: PersistentVolume
metadata:
  name: prometheus-pv
  labels:
    type: local
spec:
  capacity:
    storage: 1Gi
  accessModes:
    - ReadWriteOnce
  hostPath:
    path: "/mnt/data/prometheus"
---
apiVersion: v1
kind: PersistentVolumeClaim
metadata:
  name: prometheus-pvc
  namespace: monitoring
spec:
  accessModes:
    - ReadWriteOnce
  resources:
    requests:
storage: 1GiThe PersistentVolume (PV) and PersistentVolumeClaim (PVC) configuration above allows Prometheus to store its data on a specific node. However, the hostPath used here is dependent on the local file system of the specific node on which Prometheus is running.
For this reason:
- If Prometheus pods are moved to a different node, they will lose their data unless the new node has the same hostPath directory.
- To guarantee that pods always run on the same node, it is necessary to pin pods to specific nodes using nodeAffinity or nodeSelector.
Alternatively, NFS, Ceph, Longhorn or a cloud-based storage solution can be used to store data in a node-independent way.
ServiceAccount and RBAC Configuration
ServiceAccount and RBAC ConfigurationPrometheus needs to have the necessary permissions to discover pods and collect their metrics. For this, the following ServiceAccount, ClusterRole and ClusterRoleBinding definitions must be made:
apiVersion: v1
kind: ServiceAccount
metadata:
  name: prometheus
  namespace: monitoring
---
apiVersion: rbac.authorization.k8s.io/v1
kind: ClusterRole
metadata:
  name: prometheus
rules:
- apiGroups: [""]
  resources:
  - nodes
  - nodes/proxy
  - services
  - endpoints
  - pods
  verbs: ["get", "list", "watch"]
- apiGroups:
  - extensions
  resources:
  - ingresses
  verbs: ["get", "list", "watch"]
- nonResourceURLs: ["/metrics"]
  verbs: ["get"]
---
apiVersion: rbac.authorization.k8s.io/v1
kind: ClusterRoleBinding
metadata:
  name: prometheus
roleRef:
  apiGroup: rbac.authorization.k8s.io
  kind: ClusterRole
  name: prometheus
subjects:
- kind: ServiceAccount
  name: prometheus
namespace: monitoringModify the Prometheus Deployment YAML file below to suit your systems and install it on your Kubernetes Cluster.
apiVersion: apps/v1
kind: Deployment
metadata:
  name: prometheus
  namespace: monitoring
spec:
  replicas: 1
  selector:
    matchLabels:
      app: prometheus
  template:
    metadata:
      labels:
        app: prometheus
    spec:
      serviceAccountName: prometheus
      affinity:
        nodeAffinity:
          requiredDuringSchedulingIgnoredDuringExecution:
            nodeSelectorTerms:
            - matchExpressions:
              - key: kubernetes.io/hostname
                operator: In
                values:
                - <NODE_HOSTNAME>
      initContainers:
        - name: init-permissions
          image: busybox
          command: ["sh", "-c", "chown -R 65534:65534 /prometheus"]
          volumeMounts:
            - mountPath: /prometheus
              name: prometheus-storage
      containers:
        - name: prometheus
          image: prom/prometheus:v3.3.0
          imagePullPolicy: IfNotPresent
          resources:
            limits:
              memory: 256Mi
              cpu: 256m
          args:
            - "--config.file=/etc/prometheus/prometheus.yml"
            - "--storage.tsdb.path=/prometheus"
            - "--storage.tsdb.retention.time=7d"
          ports:
            - containerPort: 9090
          volumeMounts:
            - name: config-volume
              mountPath: /etc/prometheus
            - name: prometheus-storage
              mountPath: /prometheus
      volumes:
        - name: config-volume
          configMap:
            name: prometheus-config
        - name: prometheus-storage
          persistentVolumeClaim:
claimName: prometheus-pvcKubernetes Service is created for Prometheus.
apiVersion: v1
kind: Service
metadata:
  name: prometheus-service
  namespace: monitoring
spec:
  type: NodePort
  ports:
    - port: 9090
      targetPort: 9090
      nodePort: 30190
  selector:
app: prometheusWhen Prometheus deploys on Kubernetes, it creates a Kubernetes service named prometheus-service and of type NodePort. This service is required for access to Prometheus from outside Kubernetes. However, instead of this service, you can use Ingress or whatever structure you use for the connection method in your organization.