For Grafana Installation and Prometheus Integration as a Data Source, please see our related document.
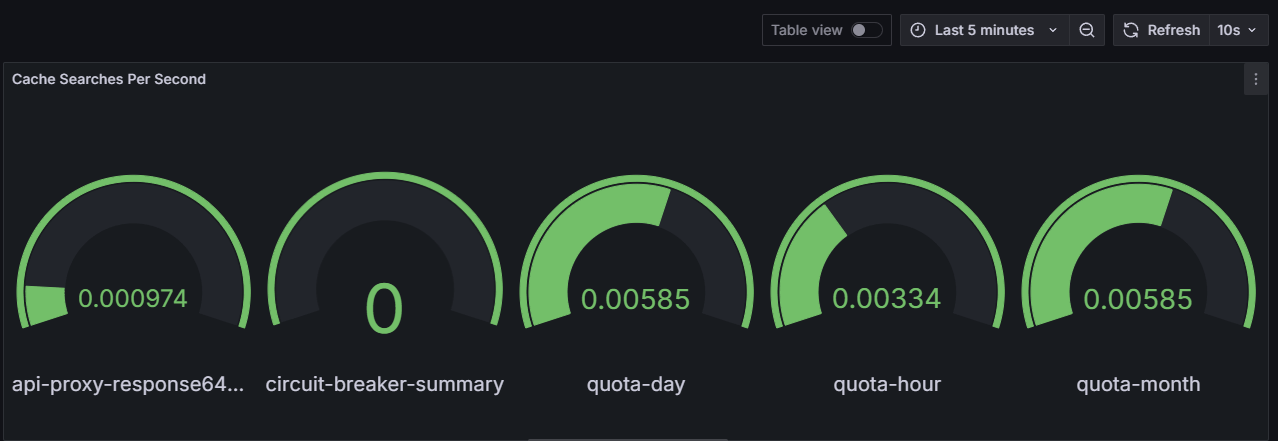
Panel 1: Cache Searches Per Second
- PromQL Queries:
- A: topk(5, sum by (cache) (rate(cache_gets_total{cache=~".*"}[2h])))
- Visualization: Gauge
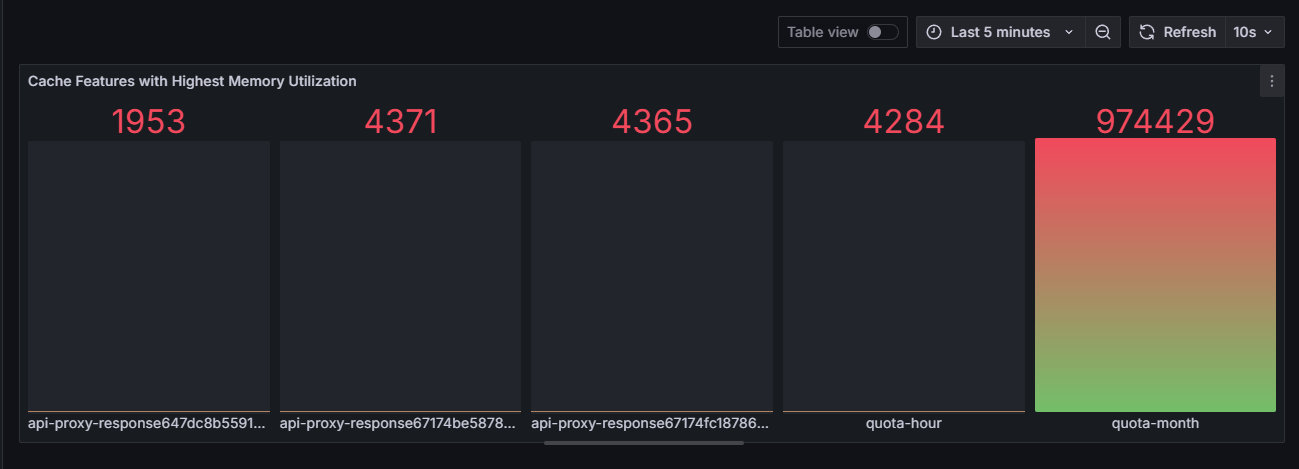
Panel 2: Cache Features with Highest Memory Utilization
- PromQL Queries:
- A: topk(5, sum by (cache) (cache_entry_memory_bytes))
- Visualization: Bar gauge or Bar chart
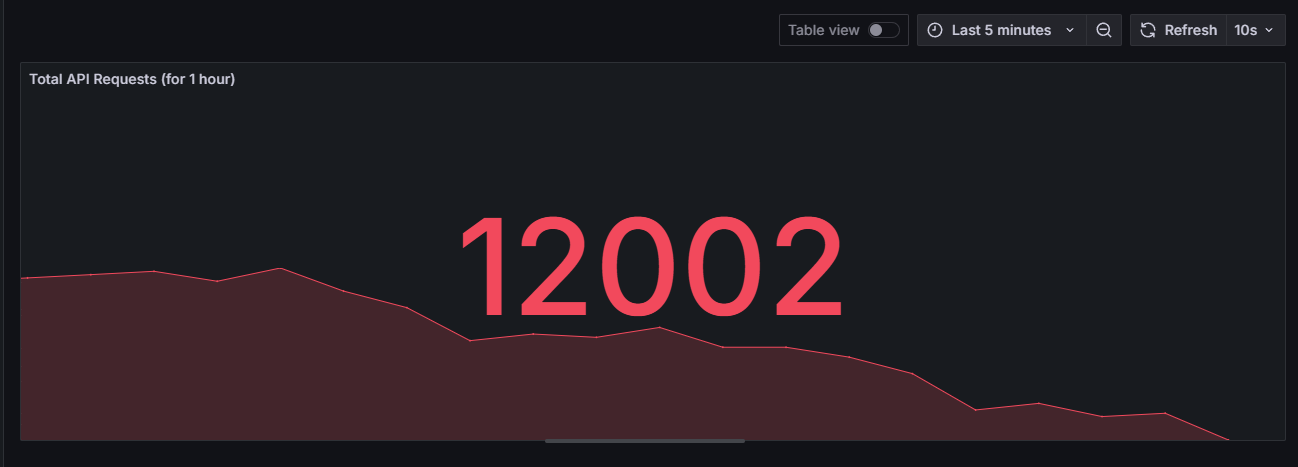
Panel 3: Total API Requests (for 1 hour)
- PromQL Queries:
- A: sum(increase(apinizer_cache_api_requests_total[1h]))
- Visualization: Bar chart or stat