API Traffic
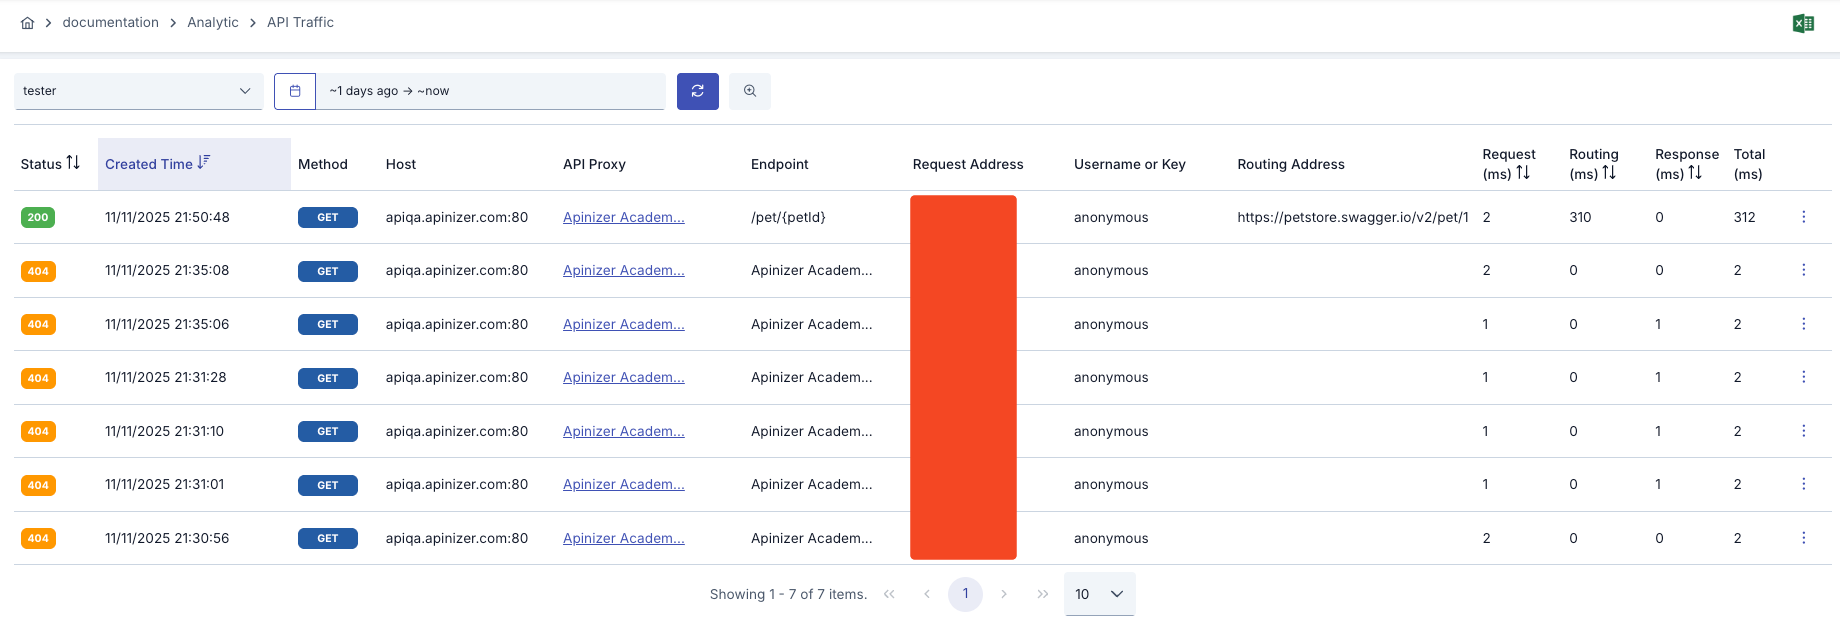
On the API Traffic screen, all requests and responses to API Proxies in the project are listed with their details. In particular, it makes it easy to investigate a problem in the message.
The picture below shows the API Traffic Records:
Since an API Proxy can be installed in more than one environment, it is necessary to evaluate the metrics according to the environment in which it is installed. For this reason, metrics are filtered by selecting environment information in all analytics screens.
Since Websocket and gRPC requests are kept as data coming to and leaving Apinizer, there are only 2 regions (incoming and outgoing) in this type of API Proxies.
Routing Address
This field holds the address information to which the relevant API Proxy is directed. If this field is empty, it means that the request is not going to the backend address.
Services that use Apinizer as the backend are indicated with the prefix "apinizer://", it will read exactly "apinizer://<COMPONENT_NAME>/<METHOD_NAME>".
This also applies to proxies whose routing address is closed and prevented from going to the backend.
Possible values are as follows;
| Routing Address | Condition |
|---|---|
| apinizer://mirror.routing/<METHOD_NAME> | API Proxy type is either one of the Swagger 2.x, OpenAPI/Swagger 3.0.x, WSDL, Reverse Proxy or No-Spec API and Routing is disabled and Mirror is enabled |
| apinizer://specresponse.routing/<METHOD_NAME> | API Proxy type is either one of the Swagger 2.x, OpenAPI/Swagger 3.0.x, WSDL, Reverse Proxy veya No-Spec API and Routing is disabled and Mirror is disabled |
| apinizer://db2api.apicreator/<METHOD_NAME> | API Proxy type is DB2API |
| apinizer://script2api.apicreator/<METHOD_NAME> | API Proxy type is Script2API |
| apinizer://mockapi.apicreator/<METHOD_NAME> | API Proxy type is Mock API |
apinizer://maintenance | API Proxy' maintenance mode is enabled |
apinizer://connector/<METHOD_NAME> | API Proxy type is Connector |
apinizer://cache/<METHOD_NAME> | Any API Proxy type withCaching enabled |
http://<BACKEND_ADDRESS>/<METHOD_NAME> https://<BACKEND_ADDRESS>/<METHOD_NAME> | API Proxy type is either one of the Swagger 2.x, OpenAPI/Swagger 3.0.x, WSDL, Reverse Proxy, No-Spec API or KPS and Routing is enabled |
apinizer://spec | API Proxy type Swagger 2.x, OpenAPI/Swagger 3.0.x, WSDL, Reverse Proxy, No-Spec API and access to spec address |
(Blank) | The request cannot reach the backend address for various reasons. |
Filtering
Search can be made by creating 2 different types of filters (Basic, Advanced) with more options.
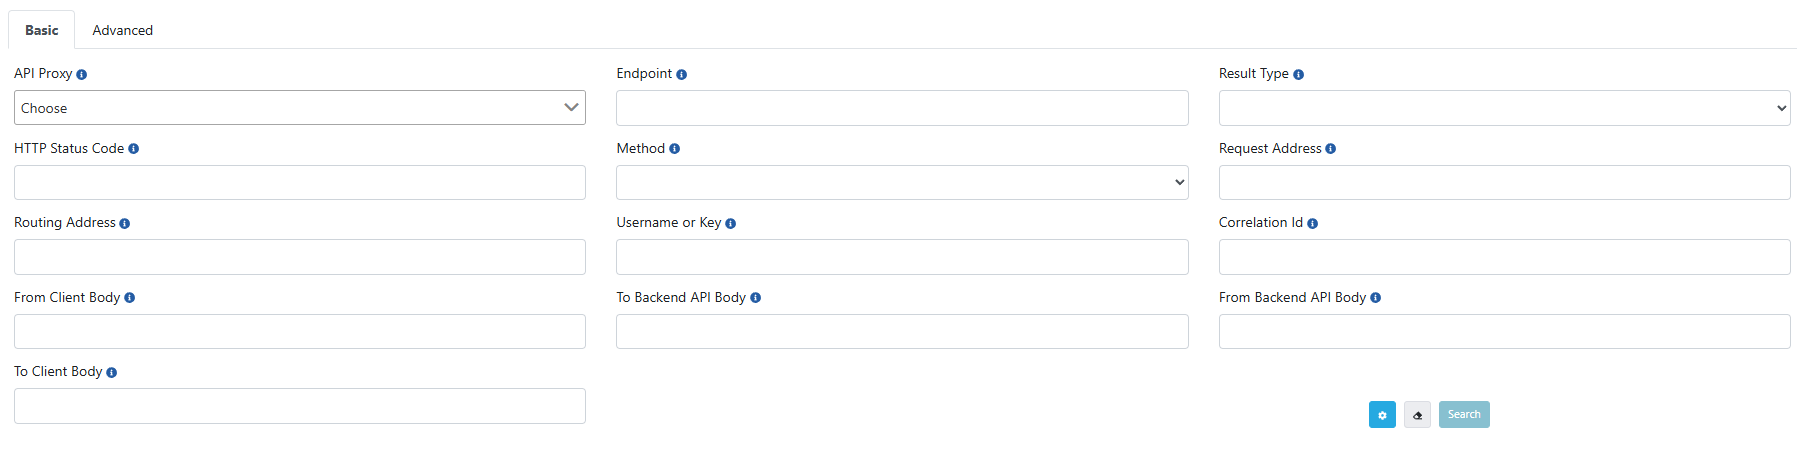
In the Basic tab, it is possible to filter the records with certain criteria such as a certain time interval, endpoint or HTTP method.
The picture below shows the Basic Search tab:
In the Advanced tab, the user can create nested filters.
The picture below shows the Advanced Search tab:
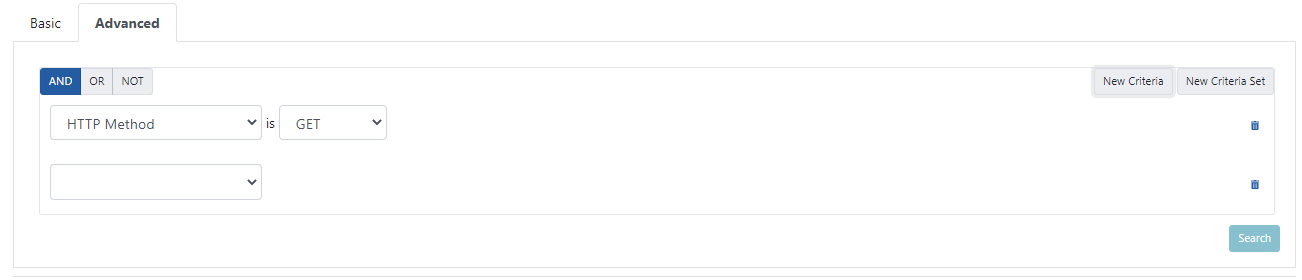
The advanced search tab is an incoming feature if the required license is available.
Query Types
Two types of queries are applied to the filtered fields;
Term Query
Logs that exactly match the searched keyword and logged data are returned. The fields applied to this query are;
API Proxy
Result Type
HTTP Status Code
Match Query
It is a query to search all text. The searched value is analyzed before the search is performed. In Match queries, it is done through the analysis type 'Standard Analyzer'.
While analysing, the text is first divided into parts based on grammatical rules (numbers, punctuation marks, etc.). These parts are then converted to lowercase letters by going through the 'Lower Case Token Filter' stage.
For example, when the text 'The 2 QUICK Brown-Foxes jumped over the lazy dog's bone.' is analyzed, '[ the, 2, quick, brown, foxes, jumped, over, the, lazy, dog's, bone ]' is converted to this form. Not all analyzed parts of the value are expected to match within the text.
It can be thought of as the OR operator between the parts. The score value is obtained based on criteria such as how many of these pieces are in the field in the log document and how often they are used. As a result of this value, related documents are returned.
- Method/Endpoint Name
- Request Address
- Response Address
- From Client Body
- To Client Body
Wildcard Query
Returns documents that contain terms matching a wildcard pattern. A wildcard operator is a placeholder that matches one or more characters. Add * character to prefix or suffix to extend your search results. The fields applied to this query are;
- Request Address
- Routing Address
Detailed View
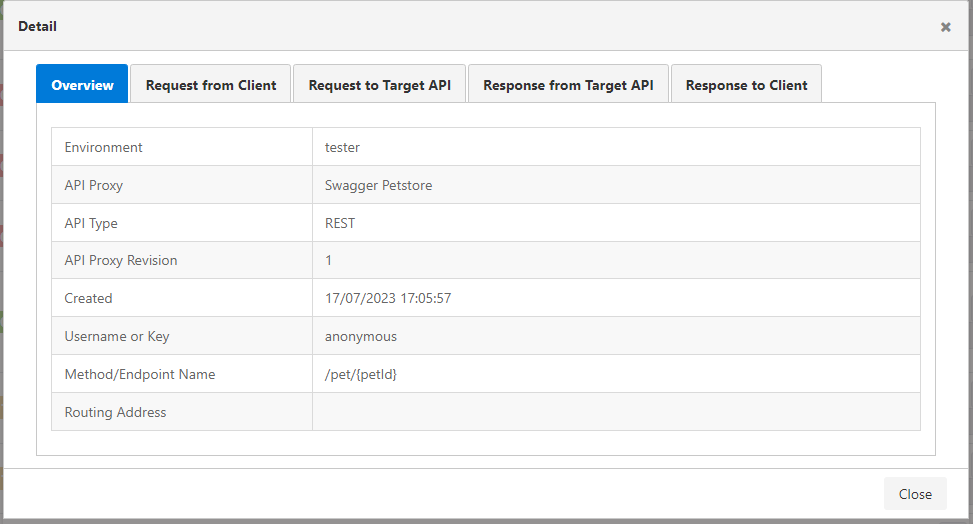
When the Detailed View button on the right side of the log record is pressed, the log information of the message is grouped according to the sections on the request and response line.
The picture below shows the Detailed View of one API Traffic Record:
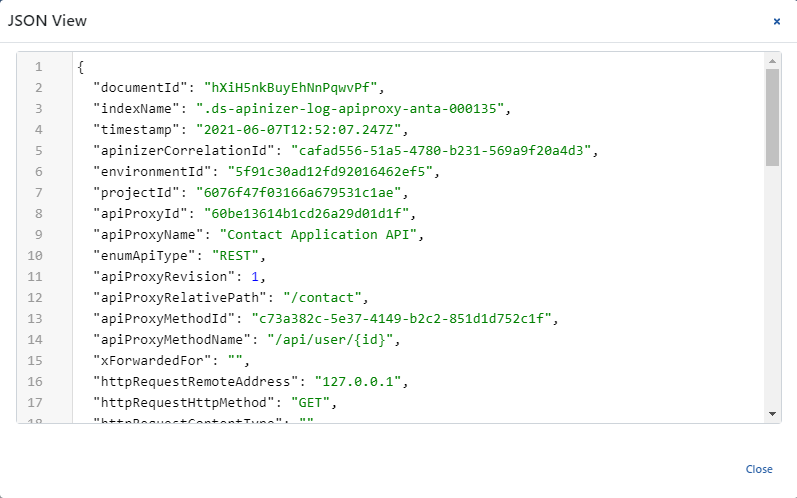
JSON View
When the JSON View button on the right side of the record is pressed, the JSON version of the log record is displayed.
The picture below shows the JSON View of API Traffic Record:
If the data size of the log record is larger than 500Kb, the View Detailed and View in JSON Format options will be turned off. In this case, it should be downloaded to examine the log record.
Download
When the Download button on the right side of the record is pressed, the JSON version of the record is downloaded in .zip format.
Quick Test
When the Quick Test button on the right side of the recording is pressed, the Test Console screen opens with the original message content placed on the Test Console, this makes it easy for the relevant record to be tested again.