Trace Tab
This tab is used for error detection by tracing the message traffic of an API Proxy.
For this, first trace mode must be activated.
Activating the Trace Mode
Before an API Proxy can be put into trace mode, that API Proxy must be installed in at least one Environment.
One of the Environments that API Proxy is deployed to is selected, and the Start button is clicked to enable trace mode for that Environment.
Only the desired data can be specifically traced with Custom Query from the filter field next to the environment selection.

When the trace mode is activated, the content of the log records for API Proxy is expanded to allow for detailed examination and continues to be stored in this way until the mode is stopped or automatically turned off by the platform after 5 minutes.
The log records being viewed are not automatically updated so that the user does not lose any records they find. For this, the Refresh Logs button is used.
The picture below shows the sample log records:

Each of the log records displayed in the table belong to the request from the client to this API Proxy and the response message to that request. The following actions can be taken regarding this message.
Since the log record of the API Call Policy is stored separately, there is a double log of the same request.
Detailed View
The first of the buttons at the end of the row of the request message to be examined opens a popup window that displays the log records of that message.
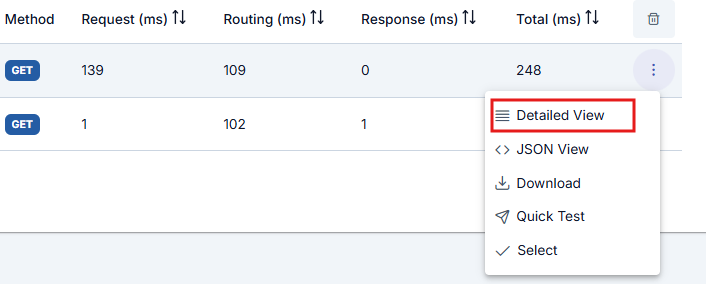
In the window that opens, it is seen that the logs are divided into sections related to the message flow. When the name of the section (for example, Request From Client to API Proxy section) is clicked on, the log records for this area are displayed. By default, the Overview section is turned on.

JSON View
The button next to the Detailed View button displays the log records in JSON format.
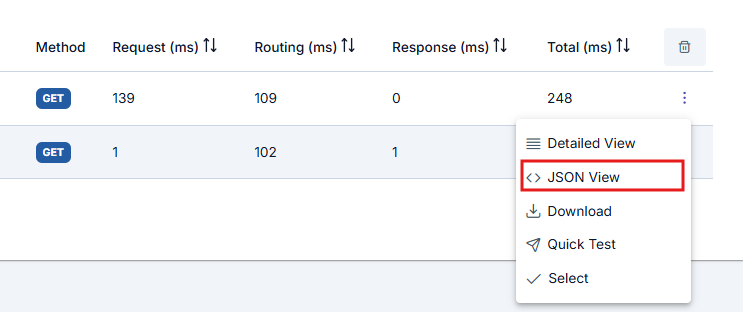
The image containing the dialog that opens when the Detailed View is clicked is given below:

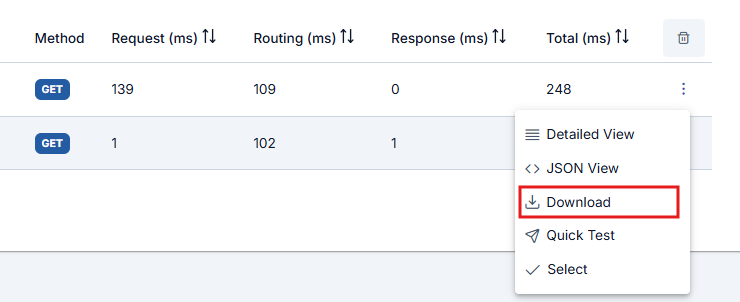
Download
While in the trace mode, Apinizer also creates detailed logs for all policies executed. The download option provides the ability to download all log records created on a request basis.
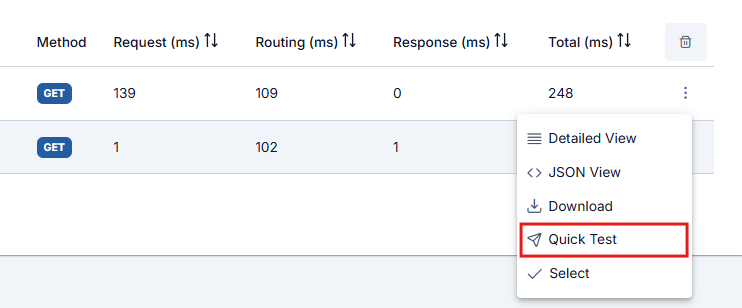
Quick
The Quick Test button on the corresponding row opens the Test Console. It is pre-configured so that the sent request can be resent and tested immediately.
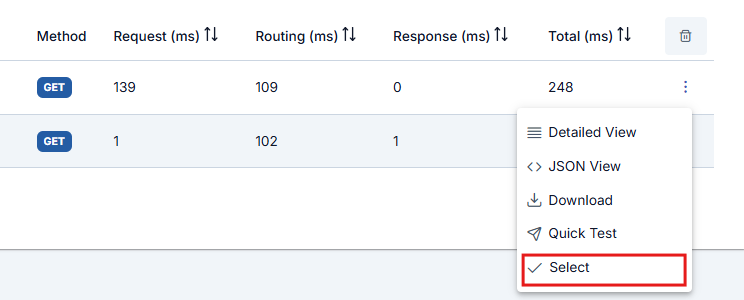
Select
The Select button is clicked to view the detailed log records of the policies executed.
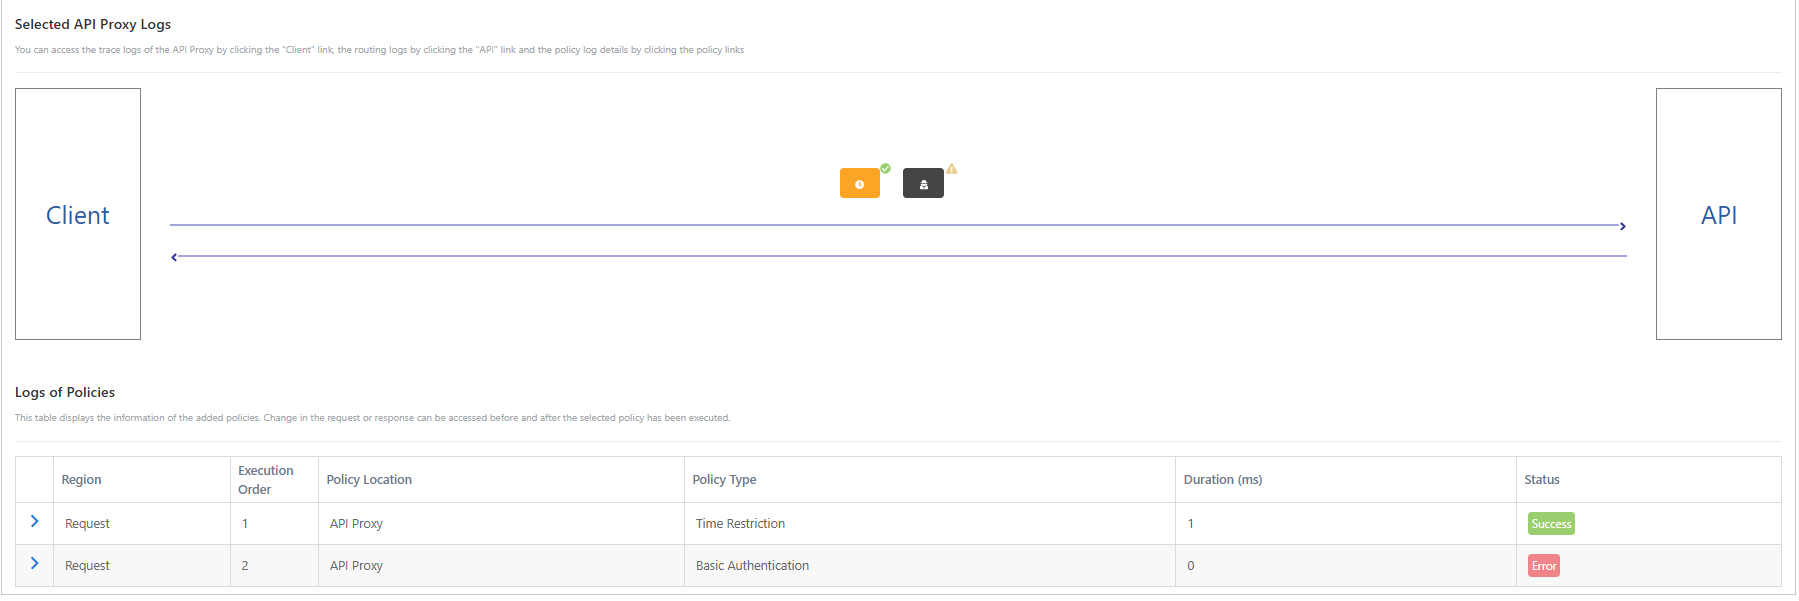
Clicking this button opens a new section under the table containing the log records. This section shows all the policies, including the ones from the API Proxy Group, in the order in which they are executed for the selected message. Next to each policy and the Backend API are small icons to indicate whether that step was executed successfully. Thus, if the message flow did not complete as expected, policy caused the problem can be seen. In the first image below, all the policies are successfully executed, and in the second image, the cases where the Authentication policy fails are exemplified.
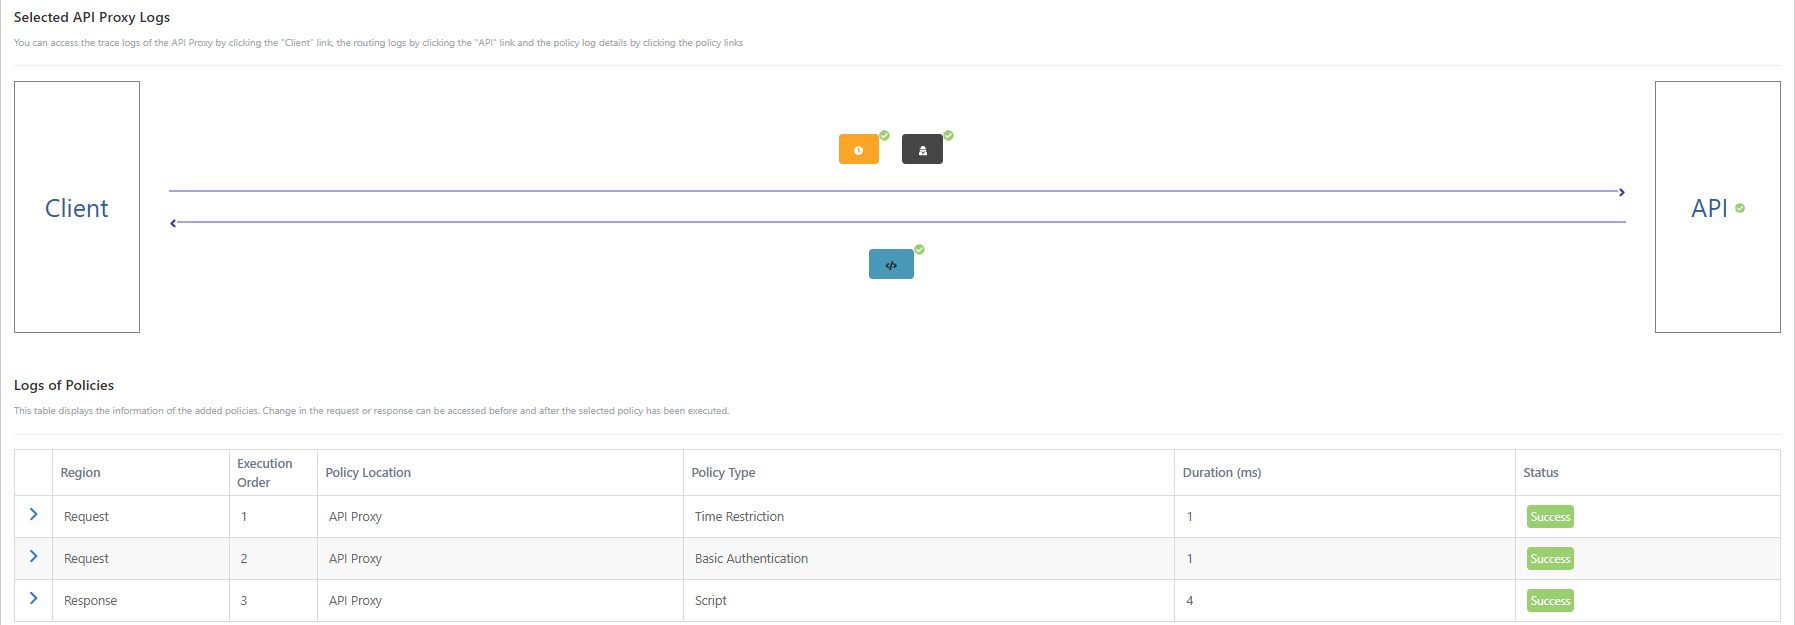
Notice that the third policy that should be executed after the Authentication policy does not appear in the second image. Because with the Authentication failure, the message flow was interrupted and an error response was returned to the client.
Detailed Log Records
The section displayed by selecting a log record presents a summary of whether the message flow was successful and, if not, at what point it failed. However, the details that can be accessed are not limited to this. In the image below, the links that can be clicked to view detailed log records are numbered.
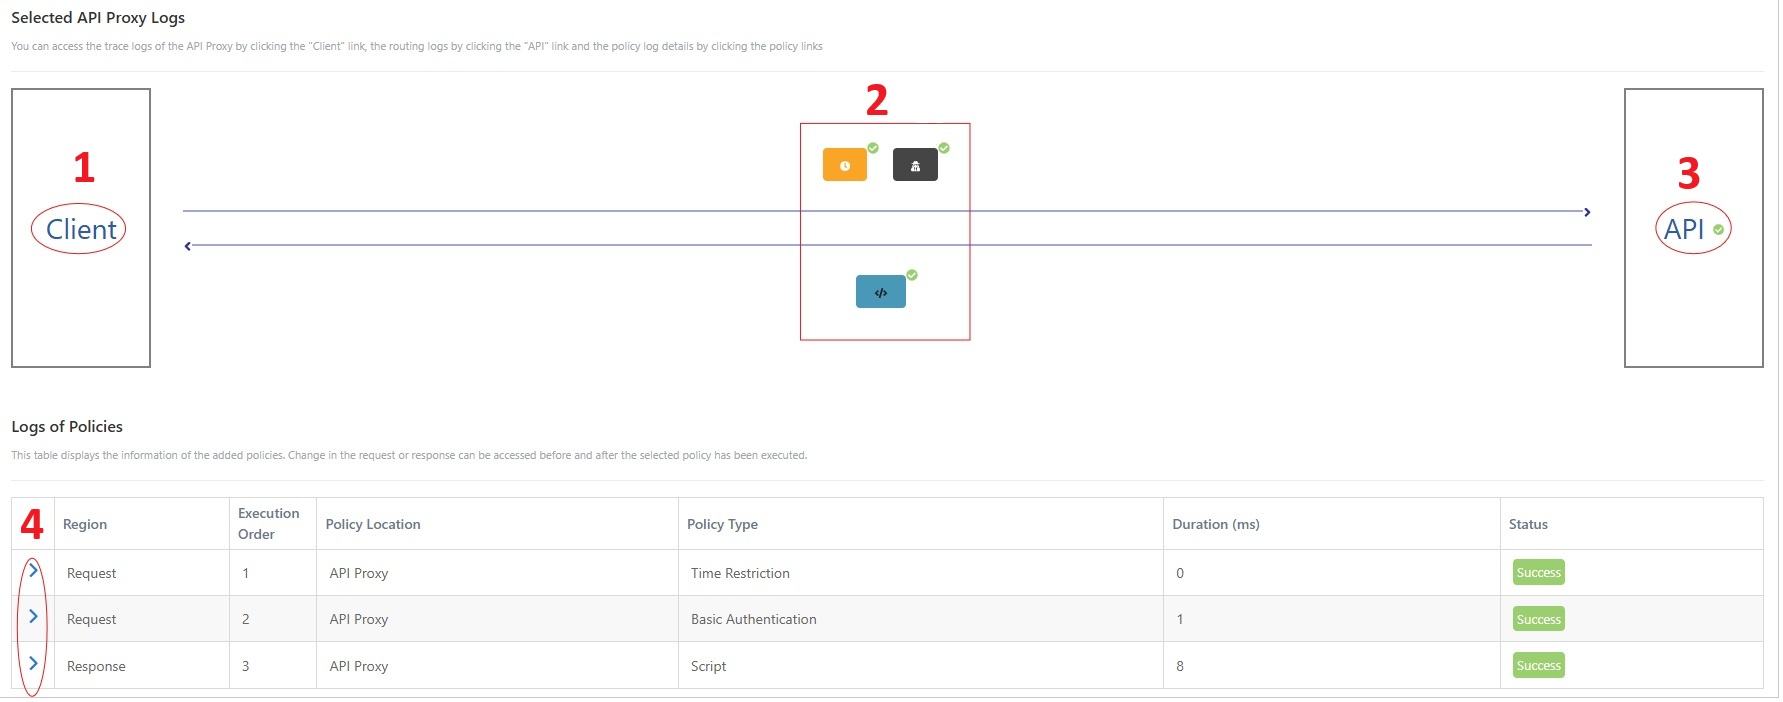
Log Records of Client - Link at region 1
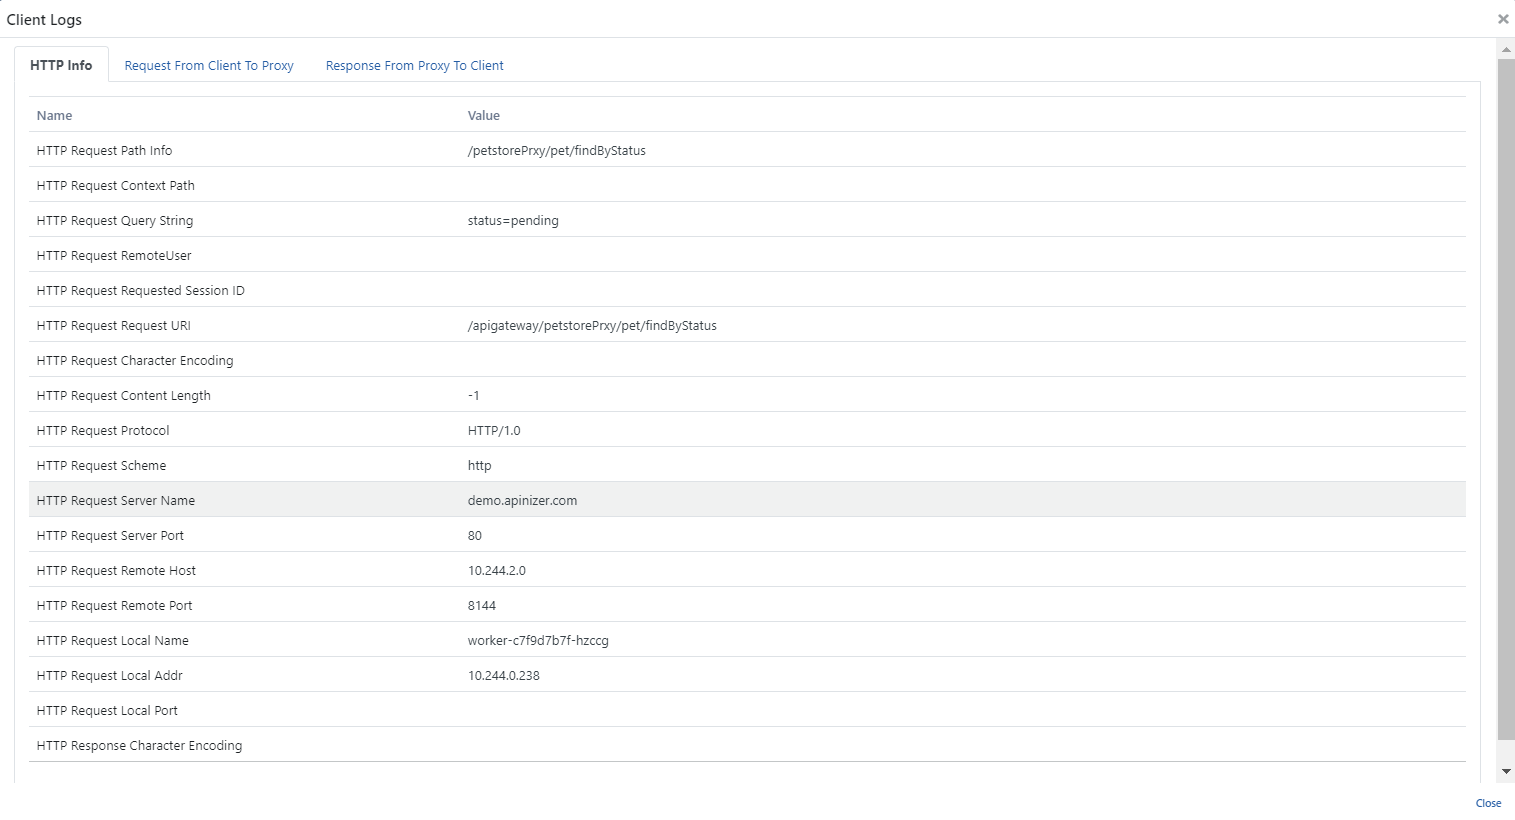
The text "Client" is a link. When this is clicked, a popup window opens in which the details of the messages sent from and returned to the client can be viewed.
The first tab shows the details of the HTTP message sent by the client to the API Proxy.
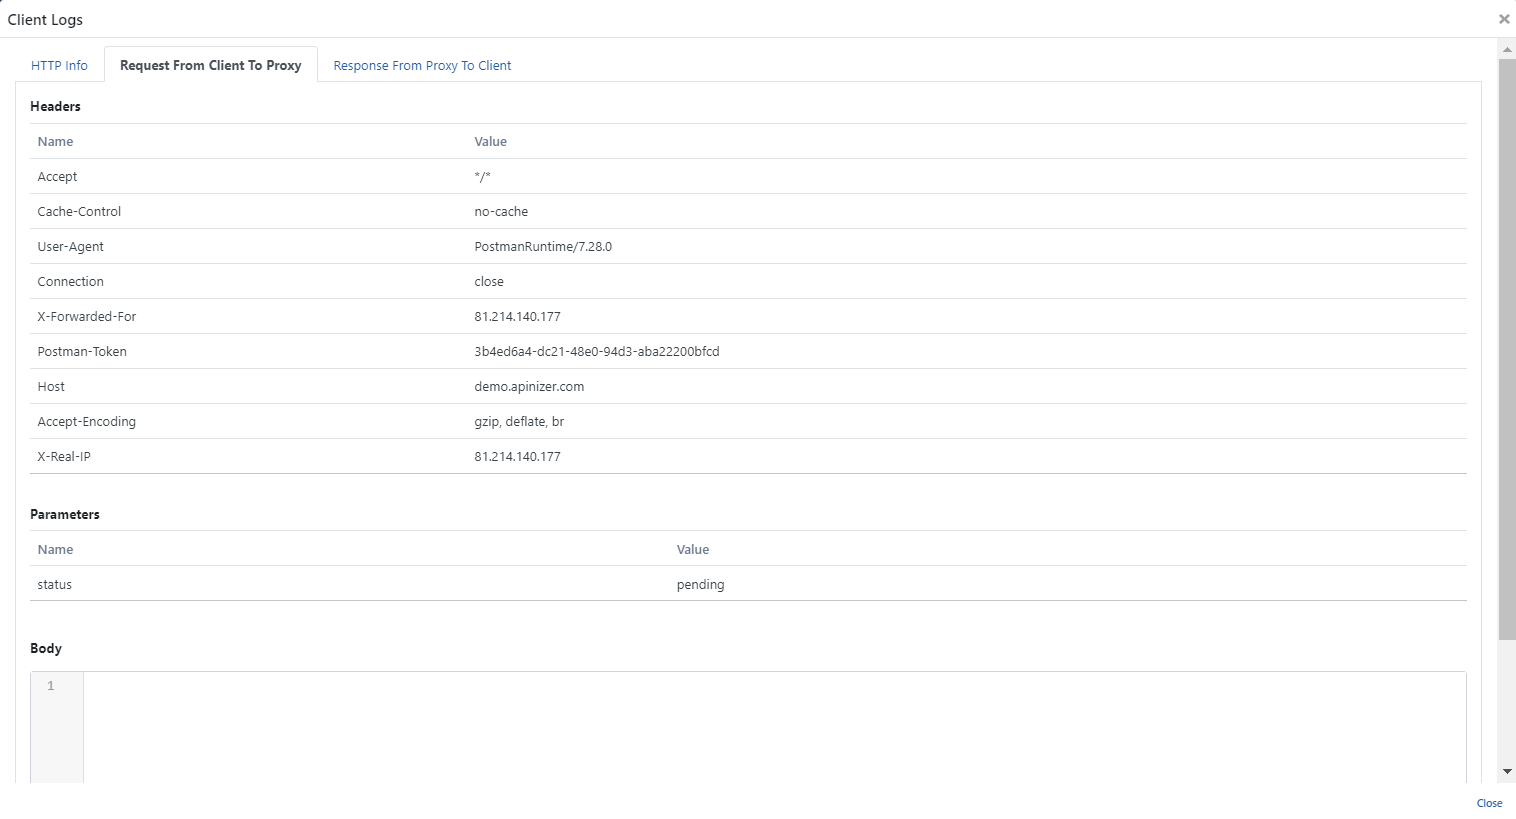
The second tab contains the content of the parts of the message sent from the client to the API Proxy.
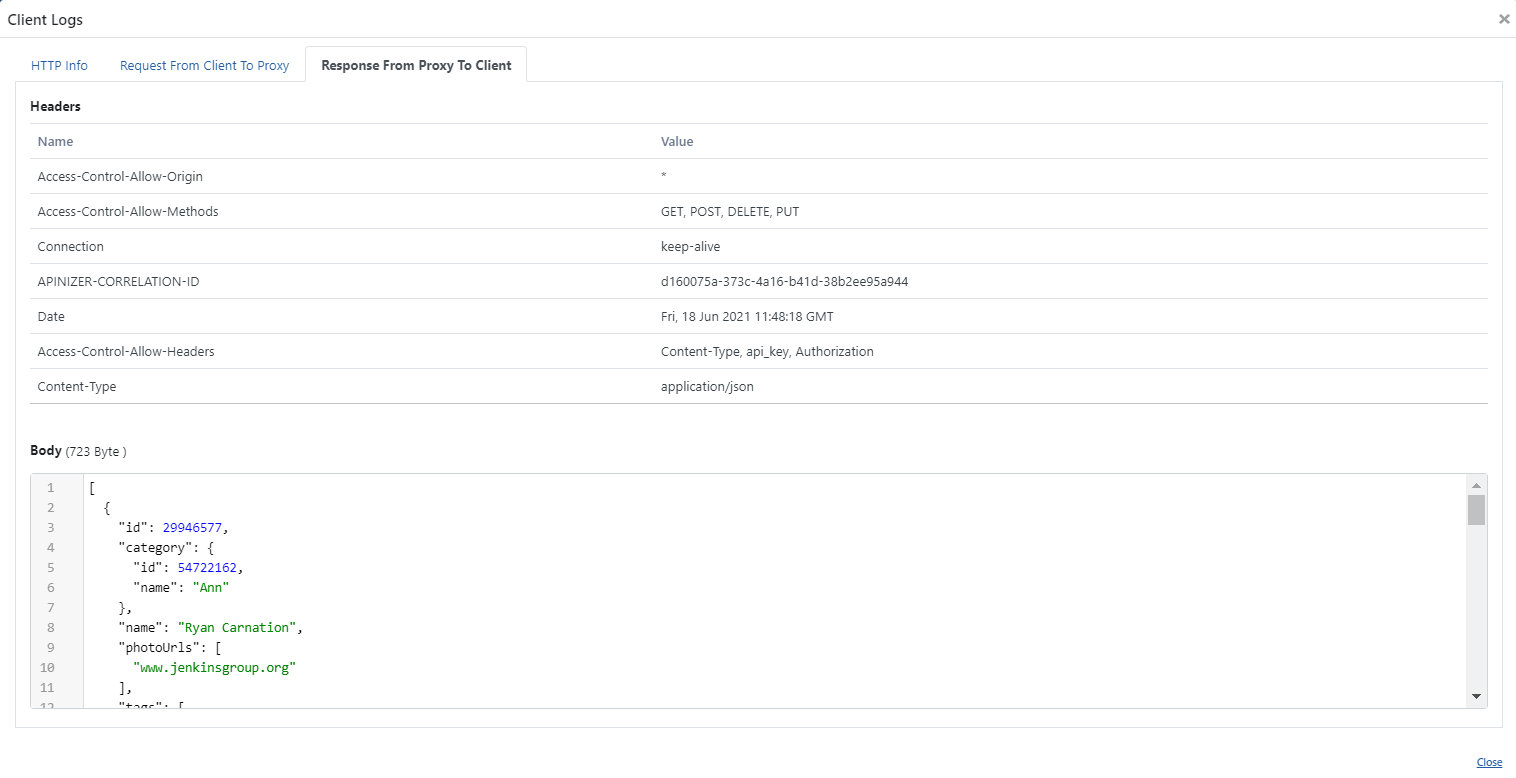
The third tab has the details of the message returned from the API Proxy to the client.
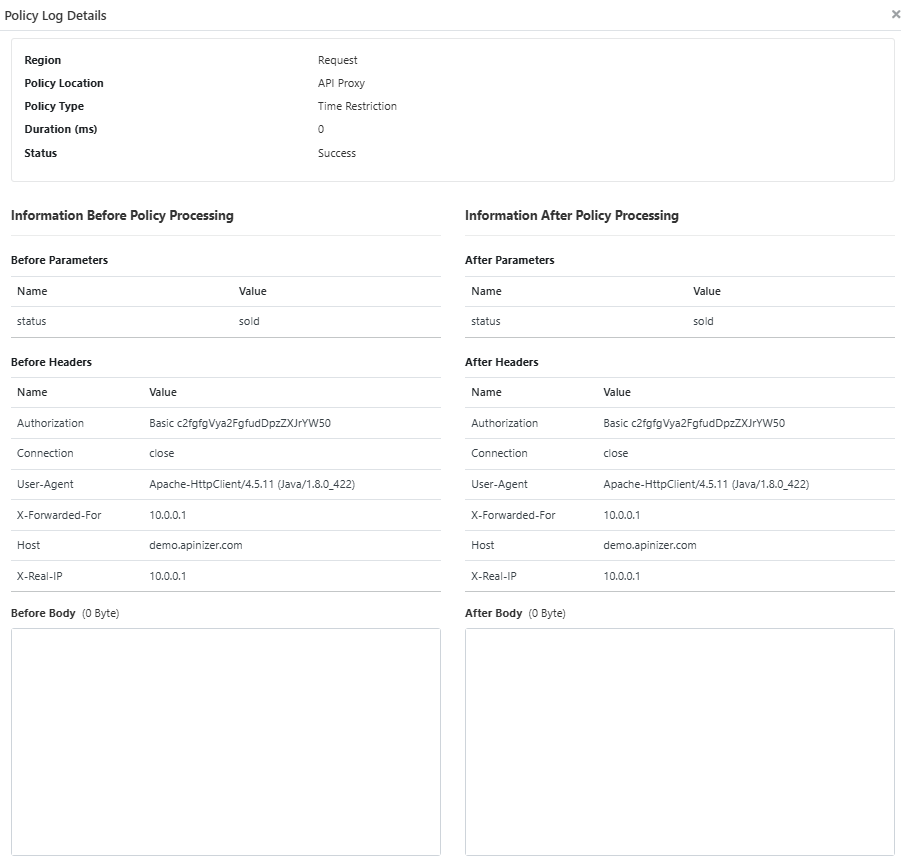
Log Records of Policies - Links at region 2 and region 4
When a policy icon in zone 2 or the arrow next to the relevant policy in zone 4 is clicked on, log records showing the content of messages before and after executing that policy are opened.
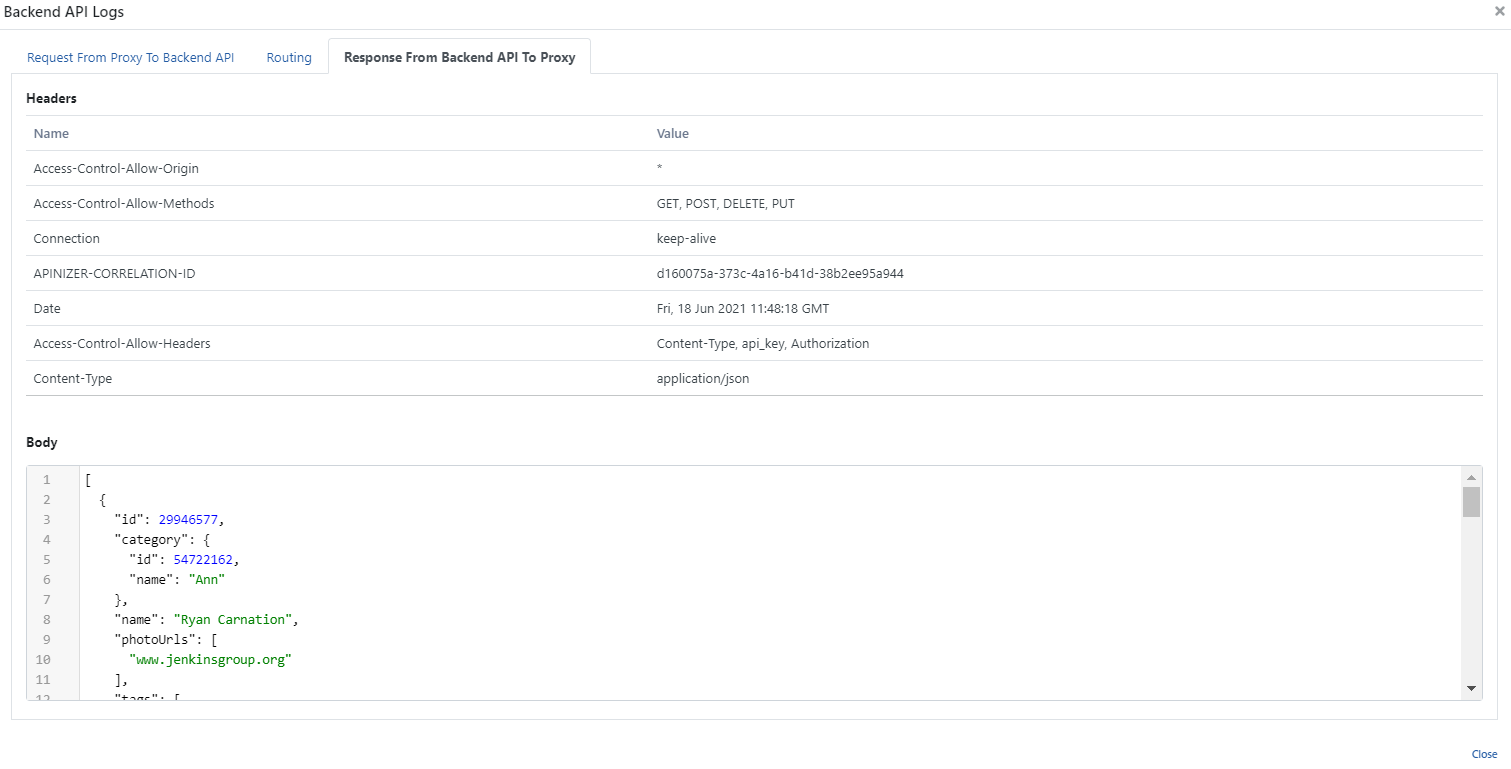
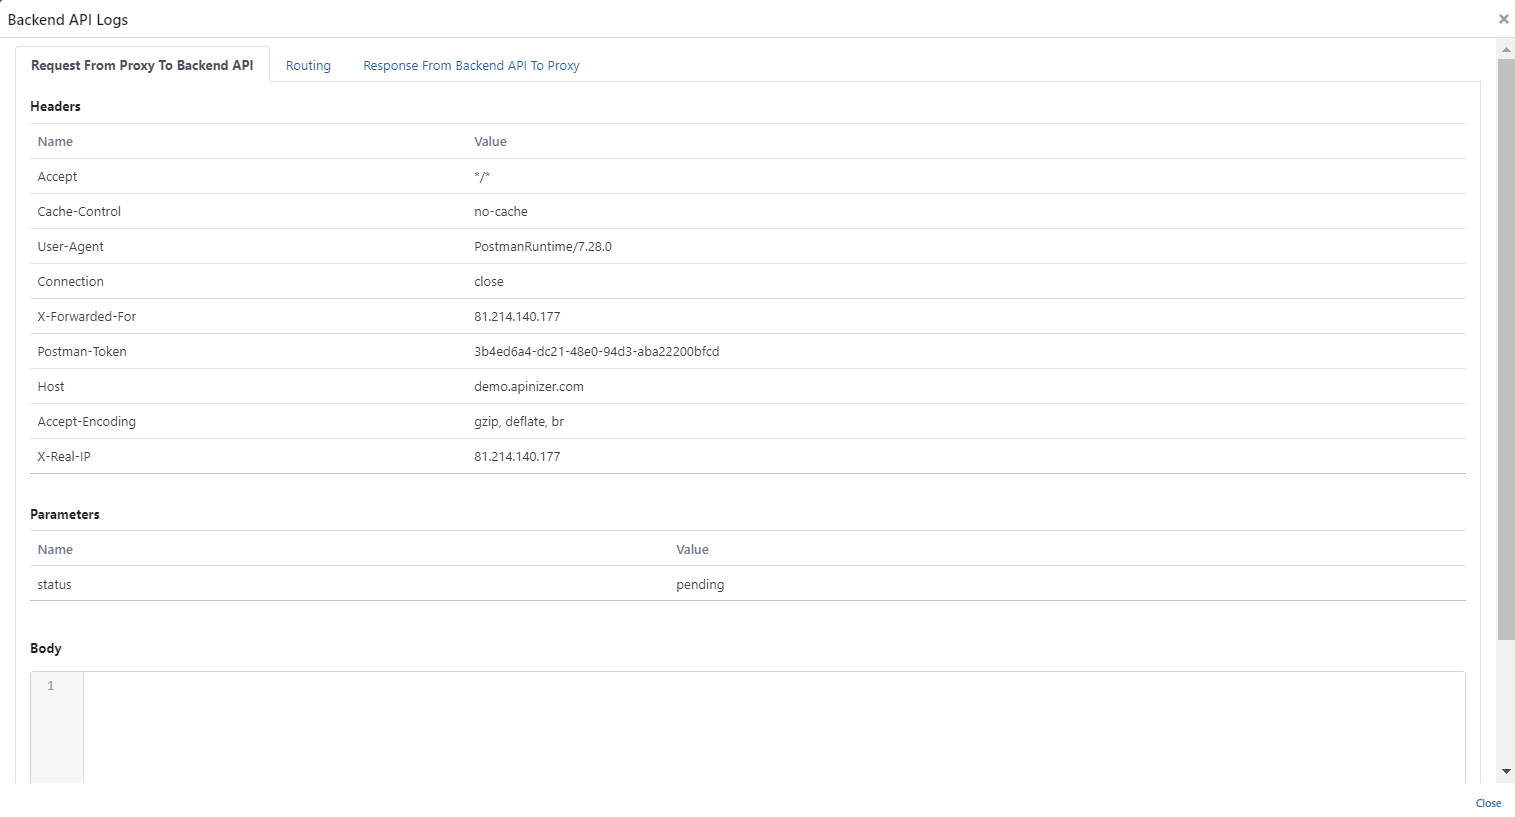
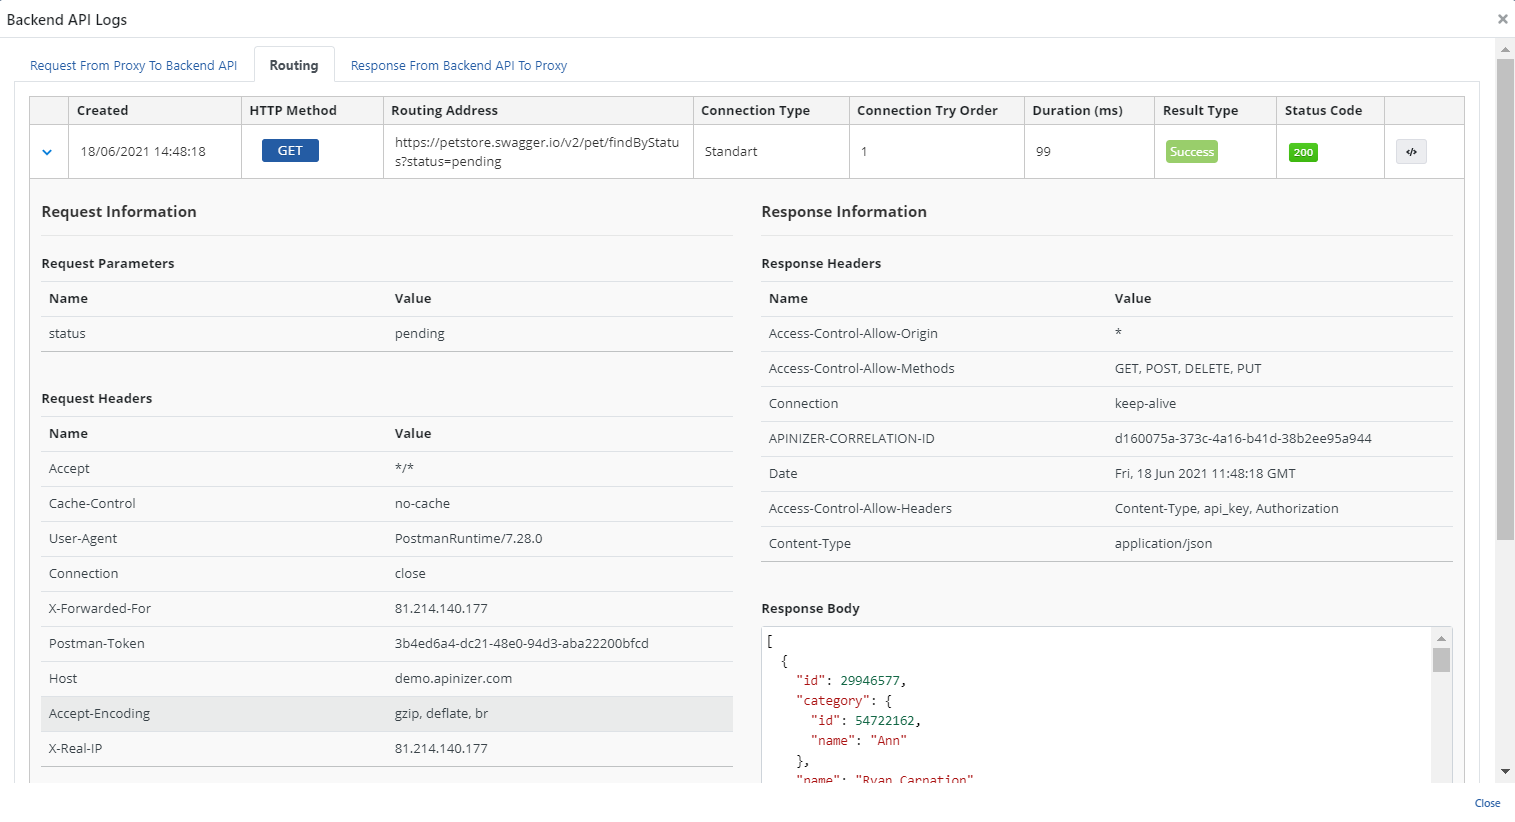
Log Records of Backend API - Link at region 3
The text "API" is a link. When this is clicked, a popup window opens where the details of the messages sent to and returned from the Backend API can be viewed.
The first tab shows the details of the message from API Proxy.
In the second tab, there is the details of the redirect to the Backend API. Please refer to Routing Tab - HTTP page for details.
The third tab contains the details of the message returned from the Backend API to API Proxy.