Anomaly Detector
The anomaly detector examines the time-based data in the log records in the specified time interval according to the defined queries and filters, and detects anomalies caught in the threshold value. Actions can be added if an anomaly is detected.
Anomaly Detection, in its simplest sense, is a technique for finding unexpected situations or patterns in a data. These contingencies or patterns are actually situations or patterns that do not conform to the expected behavior of a data. These unexpected situations are called outliers, exceptions or anomalies in the literature.
Let's say you spend about 200-300 $ on your credit card every month. In other words, in your bank's profile, you are a customer who makes low-budget expenditures every month. So what happens if you make a purchase of 1500 $ one day?
In fact, this indicates that you are out of your normal behavior and that you are a customer who normally spends 200-300 $ at the most, but suddenly you become a customer who unexpectedly spends 1500 $. This is actually an anomaly behavior. In this case, if your bank uses anomaly detection techniques, it predicts that it may be a credit card fraud and sends you a message. This simple example is actually an example of anomaly detection.
The picture below shows the Anomaly Detector settings:
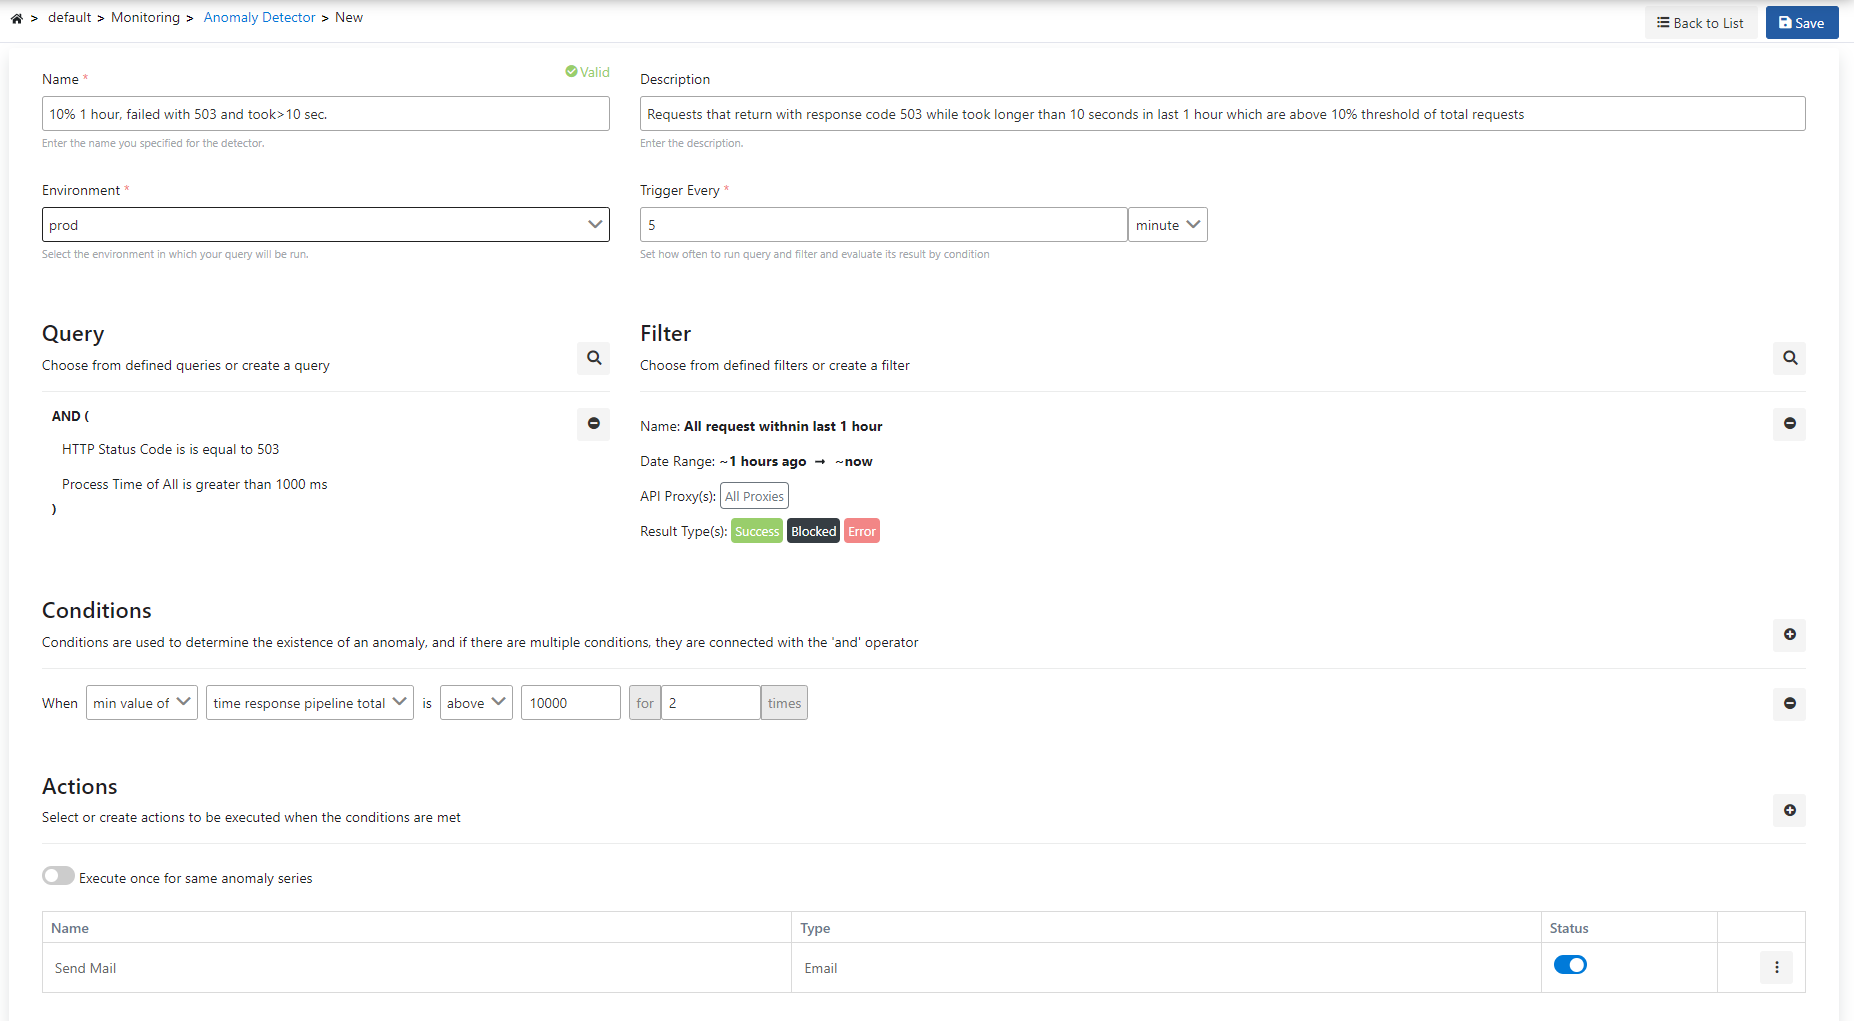
The fields used for the anomaly detector configuration with the query are shown in the table below.
Field | Description |
|---|---|
| Name | It is the name information of the created detector. |
Description | A description can be written to facilitate the management of the created detector. |
Environment | An environment is selected for the created detector. |
Trigger Every | The operating frequency of the monitor created is determined. |
Query | It is the query information created/selected to analyze the log records. A new query can be created and/or a selection can be made from existing queries. |
Filter | It is the filter information to be added to the created/selected query. A new filter can be created and/or an existing filter can be selected. |
Conditions | Conditions are used to determine the existence of an anomaly, and if there are multiple conditions, they are connected with the 'and' operator. |
Action | It enables the selection of the action to be taken when the created monitor is operated. You can visit this page for detailed information about the actions. |
Conditions
There are 4 different types of metric measurements:
- Metric value check
- Metric increase/decrease rate control
- Use of bollinger bands with EMA
- Query/Filter rate check
1.Metric Value Check
The picture below shows an example of the metric value control:
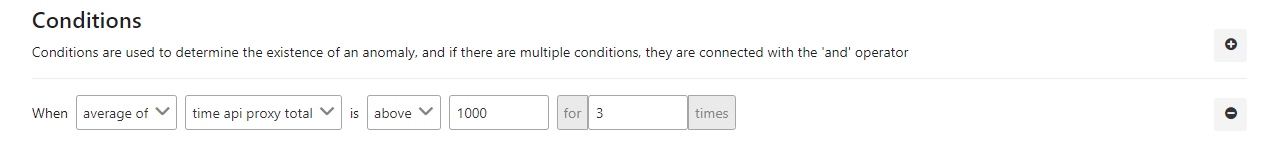
The fields used for the condition are shown in the table below.
Field | Description |
|---|---|
| average of | This field indicates the process by which the value in the next column will be handled with. In this example, the average value was selected. |
| time api proxy total | Specifies which metric field will be processed. In this example, API Proxy total time is selected. |
| above | An expression is specified that indicates how the found metric will be compared with the next value. |
| for ... times | Indicates that this condition must have been met for the last ... times. |
2.Metric Increase/Decrease Rate Control
The picture below shows an example of the metric increase/decrease rate control:
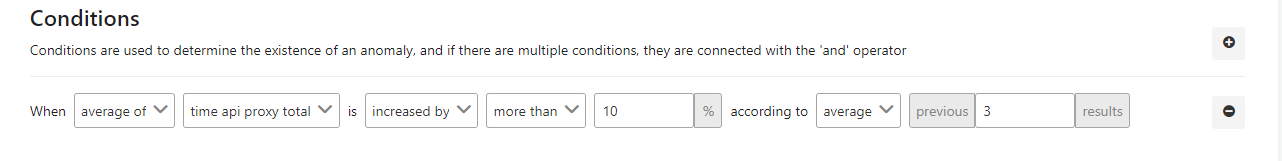
The fields used for the condition are shown in the table below.
Field | Decription |
|---|---|
| average of | This field indicates the process by which the value in the next column will be handled with. In this example, the average value was selected. |
| time api proxy total | Specifies which metric field will be processed. In this example, API Proxy total time is selected. |
| increased by | It is stated what the behavior of the found metric will be. In this example, the increasion rate has been selected. |
| more than | It specifies how the metric behavior will be compared to the previous value. In this example, the more than comparison has been selected. |
| average | Specifies how to handle previous results. In this example, it indicates that the "Average" of the previous ... values to be handled. |
| previous ... result | Indicates that this condition must have been met for the last ... times. |
3.Use of Bollinger Bands with EMA
The picture below shows an example of the use of bollinger bands with EMA:
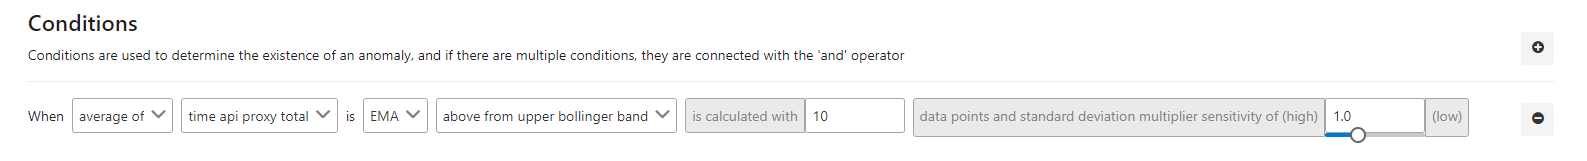
The fields used for the condition are shown in the table below.
Field | Description |
|---|---|
| average of | This field indicates the process by which the value in the next column will be handled with. In this example, the average value was selected. |
| time api proxy total | Specifies which metric field will be processed. In this example, API Proxy total time is selected. |
| EMA | Specifies what to do with the selected metric value. In this example, the EMA value is selected. |
| above from upper bollinger band | Specifies how the result of the applied EMA formula will be handled in condition. In this example, values above the Upper Bollinger Band value have been selected. |
| is calculated with | It indicates how many previous values the EMA value will be calculated from. In this example, the value 10 is selected. |
| data points and standard deviation multiplier sensitivtiy of | Indicates the degree of sensitivity. |
4.Query/Filter Rate Check
The picture below shows an example of the use of Query/rate Filter check condition:
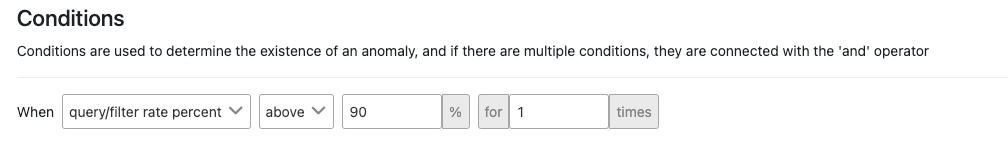
Field | Description |
|---|---|
| query/filter rate percent | It allows the ratio of the result in the filter and query to the result in the filter only to be expressed as a percentage. |
| above | An expression is specified that indicates how the found metric will be compared with the next value. |
| 90 | The value to which the metric will be compared is specified. |
| for ... time | Indicates that this condition must have been met for the last ... times. |
The picture below shows the Anomaly Detector result list:
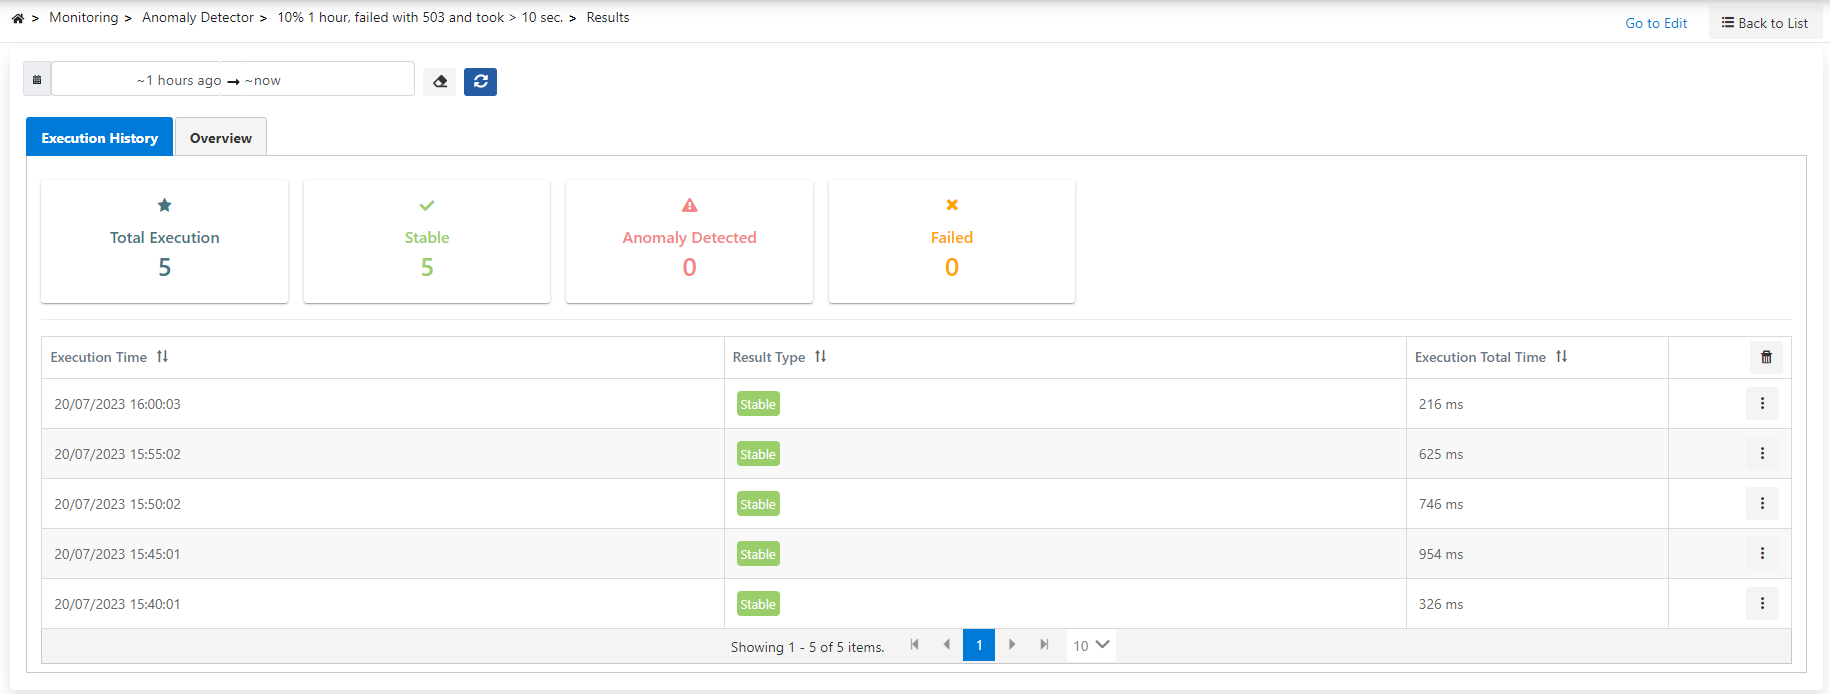
The operation records and results of the monitor can be viewed in detail in this page.
It is also possible to see these values graphically in the Overview tab.