Anomaly Detector Usage
Creating General Definition Information for Anomaly Detector
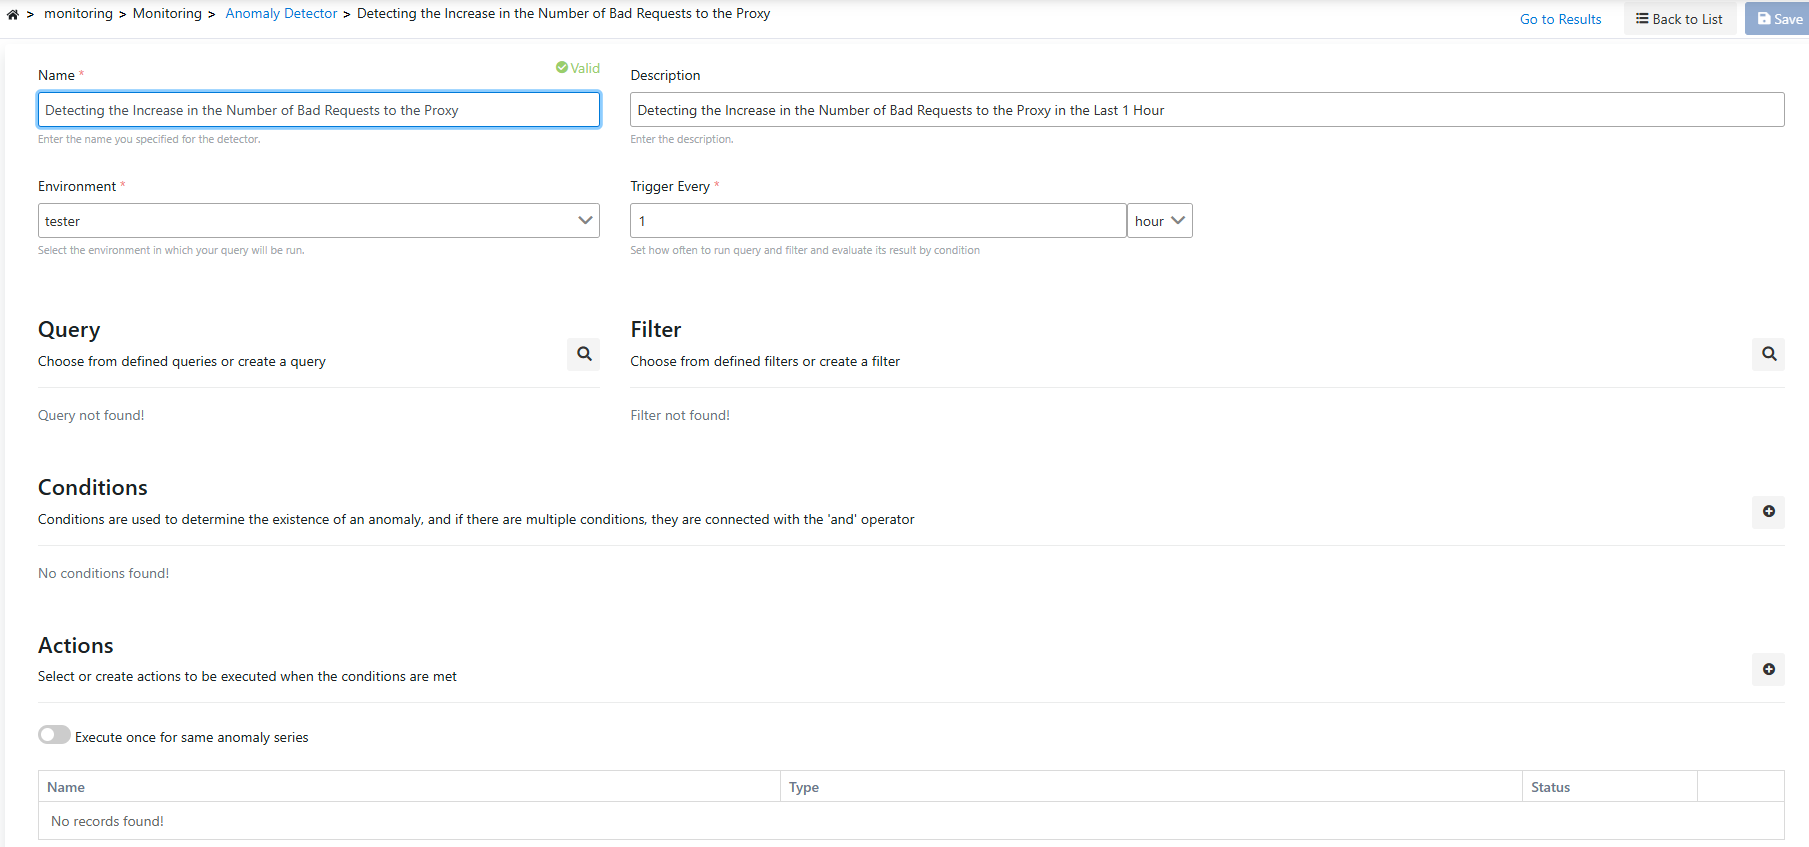
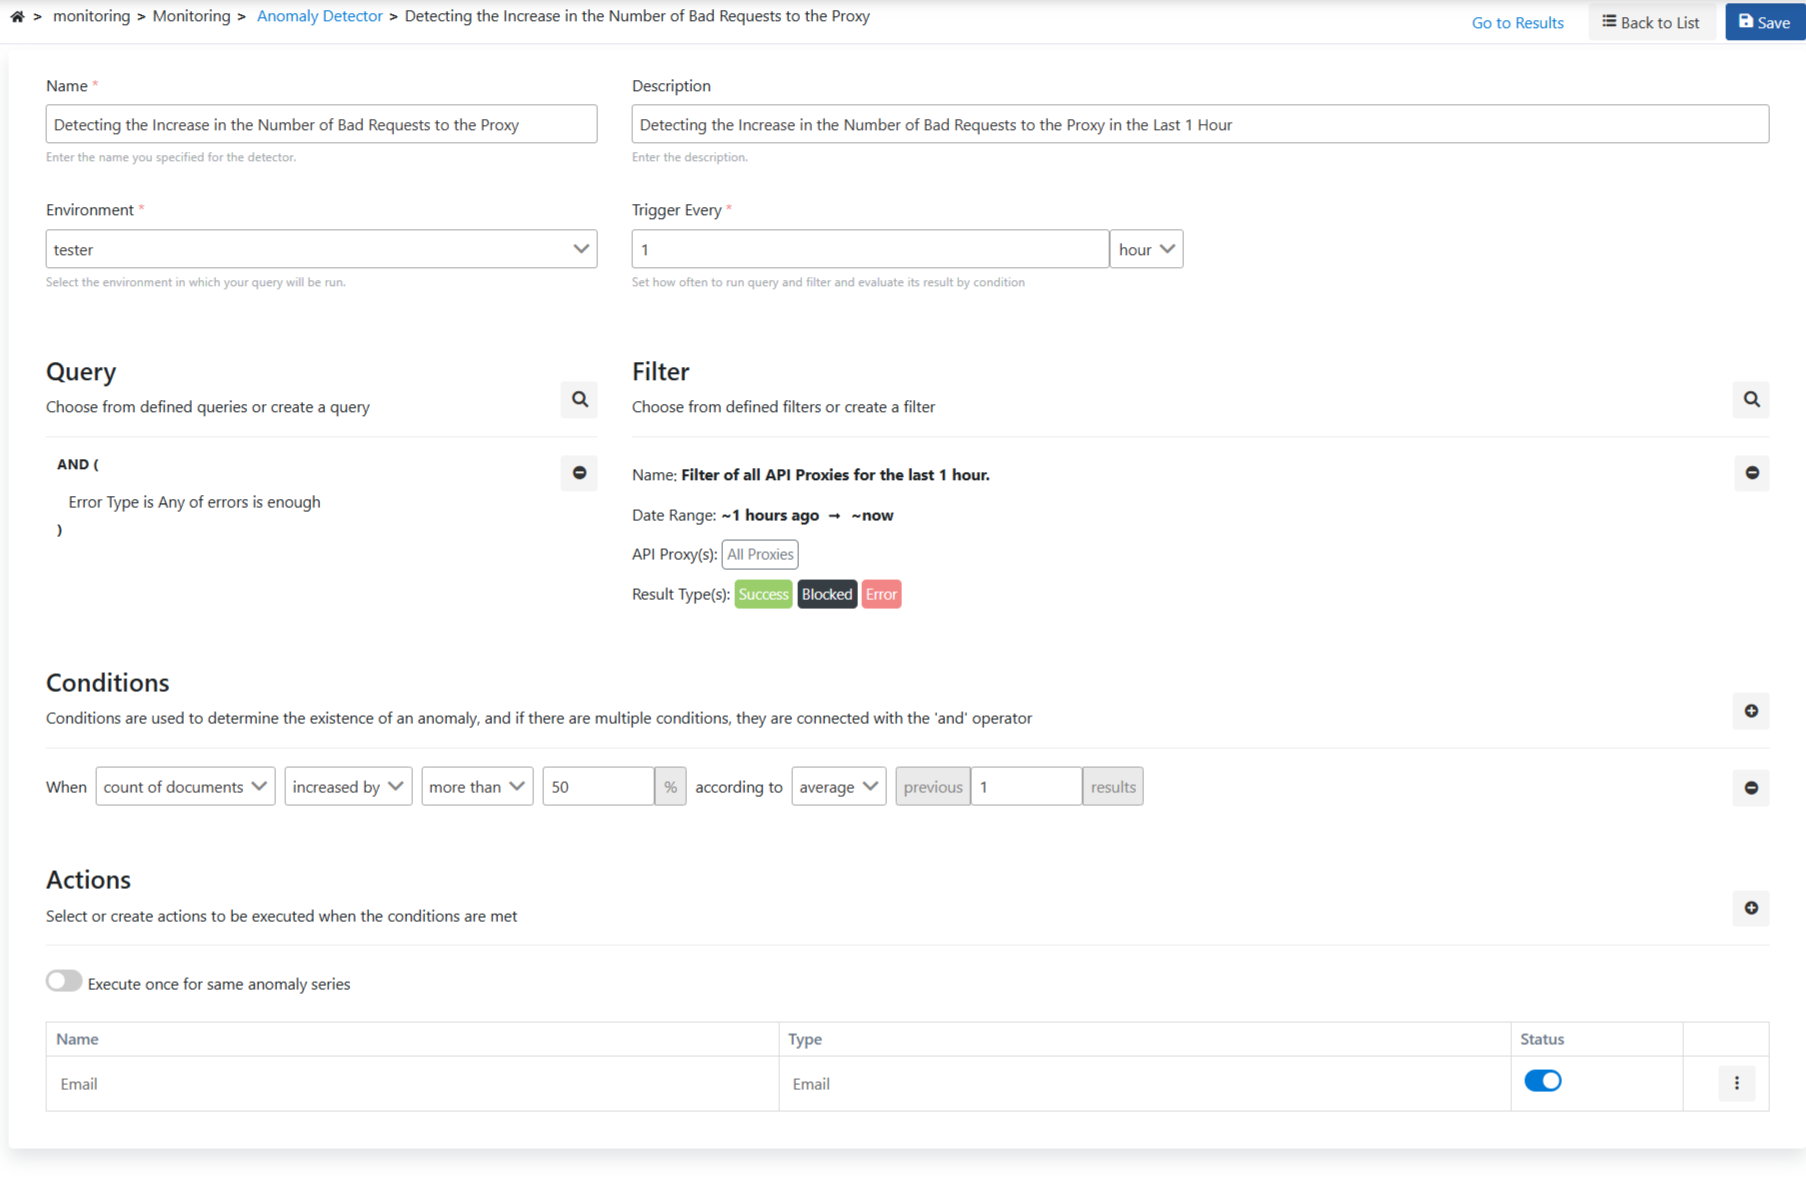
In the first stage, the identifying information of the job is entered. The most important field here is the environment information option. Queries and filters are executed on the log server in the selected environment information.
Creating Query
A query is created by combining specific fields (HTTP Method, Error Type, etc.) that will match log records with criteria of and / or / not types to create expected conditions.
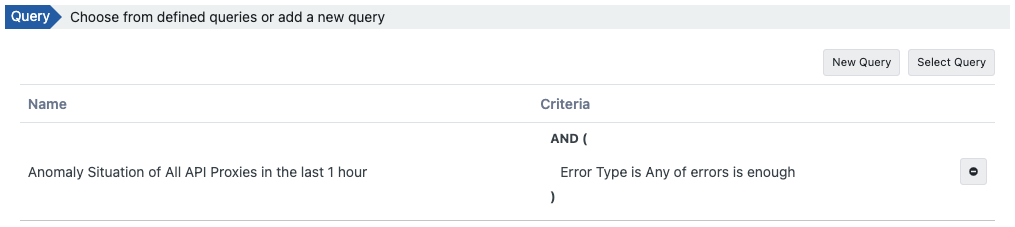
To create a new query, it is created from the Query section.
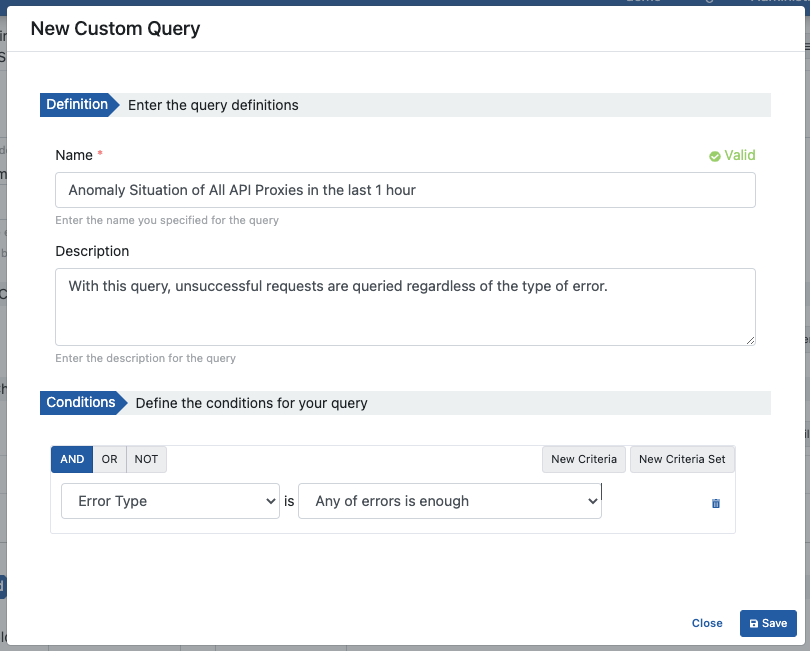
When the Save button is clicked, the created query is added to the job being defined.
To go to the Queries screen where all queries are managed and get detailed information, click here.
Creating Filter
Filters are applied together with queries. They contain the criteria that log records will match.
To create a new filter, it is created from the Filter section.
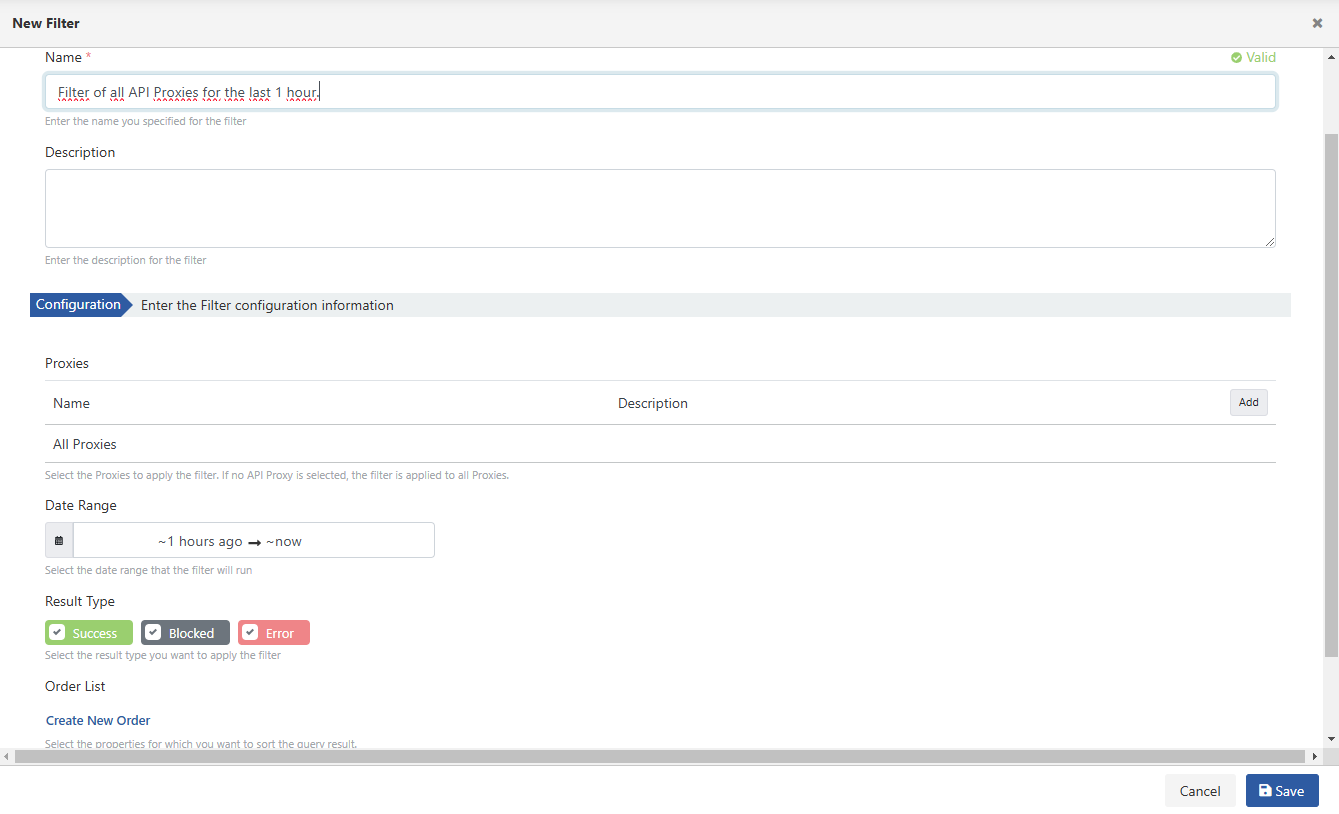
When the Save button is clicked, the created filter is added to the job being defined.
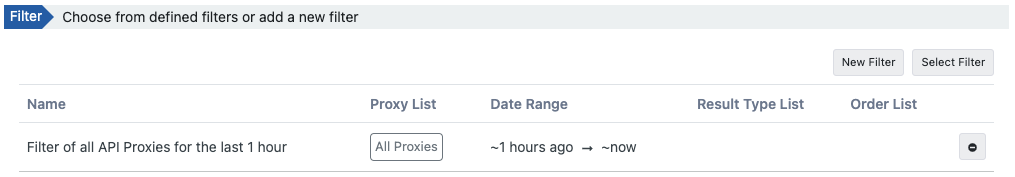
To go to the Filters screen where all filters are managed and get detailed information, click here.
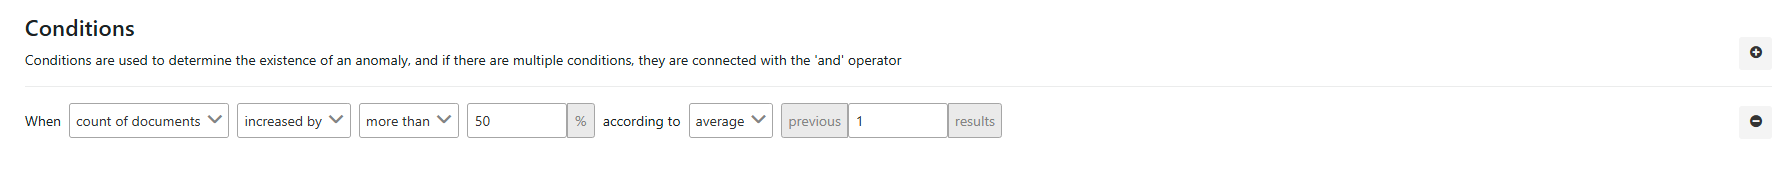
Conditions
In the following condition, 'count of documents' will look at the request count. It will check if there is an increase of more than "50%" compared to the average.
In this case, the "'1 Result'" expression indicates that if the anomaly occurs only once, it will be considered as an anomaly.
Actions
When anomaly detection is performed, we can create an alert system. In this example, we will make it send an email when an anomaly occurs.
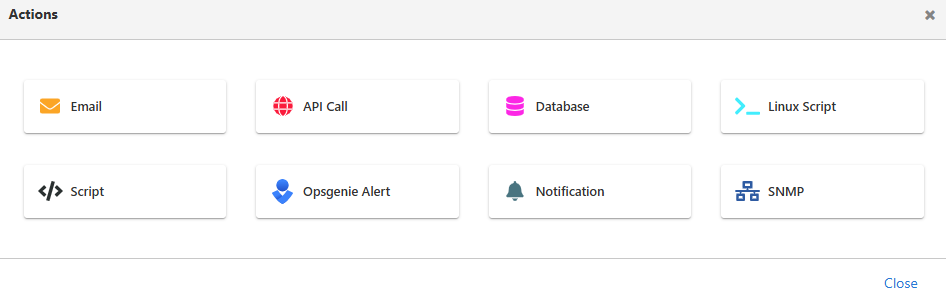
In the 'Server' field, you can add new mail connection information or select an existing one. The address, subject, and message to which the email will be sent are entered and saved.
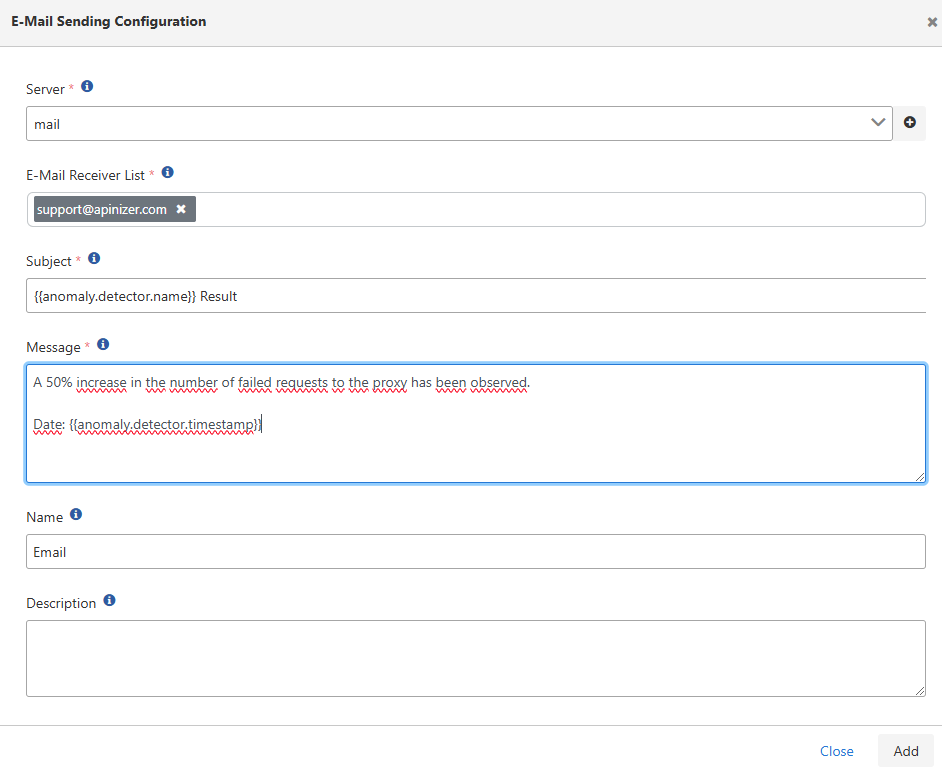
To get information about action types, action usage, and variables within tasks, click here.
Save
In the final state, the information will appear as follows, and let's make it ready for monitoring with the save button.
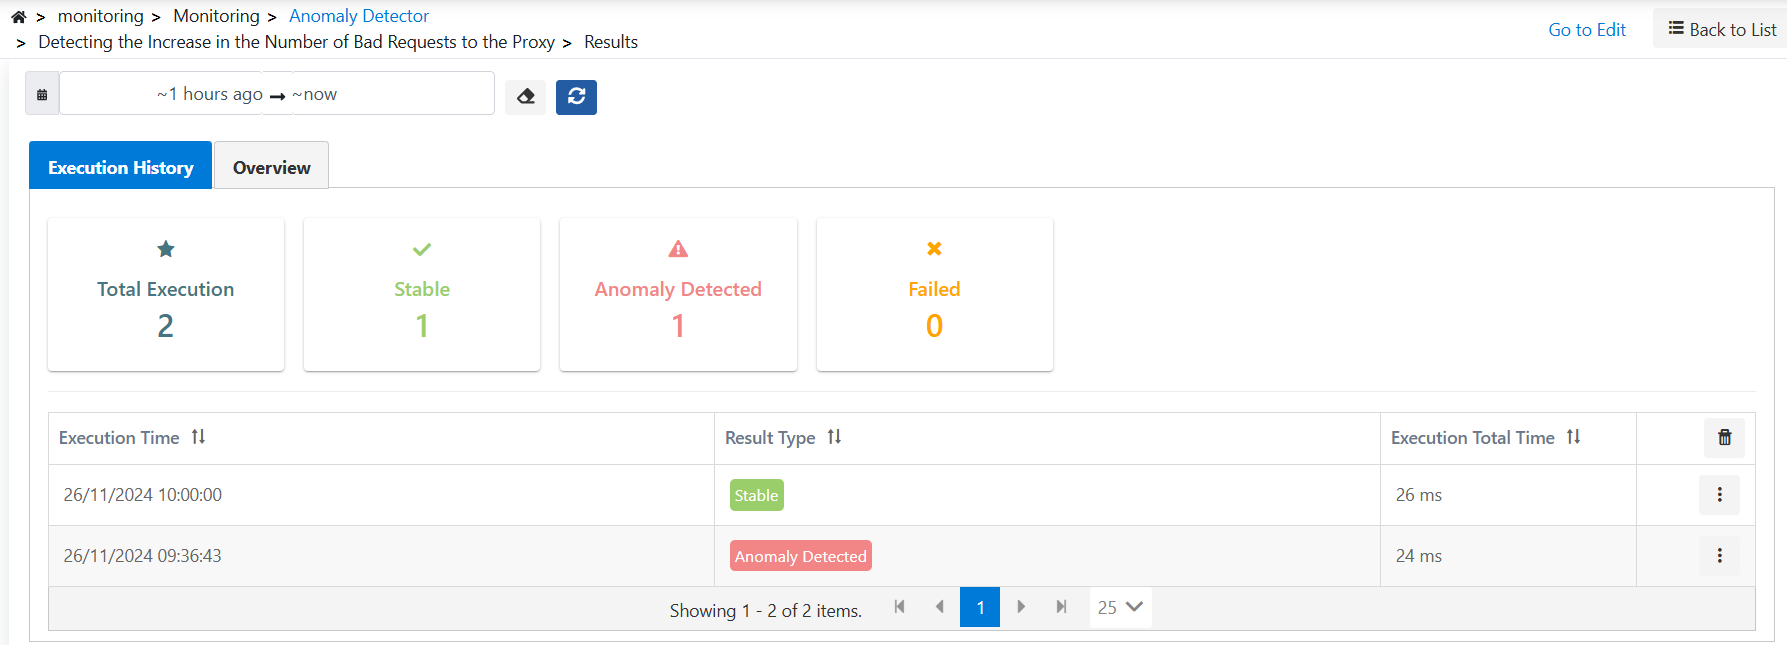
Examining Job Details
You can check with the Result option.
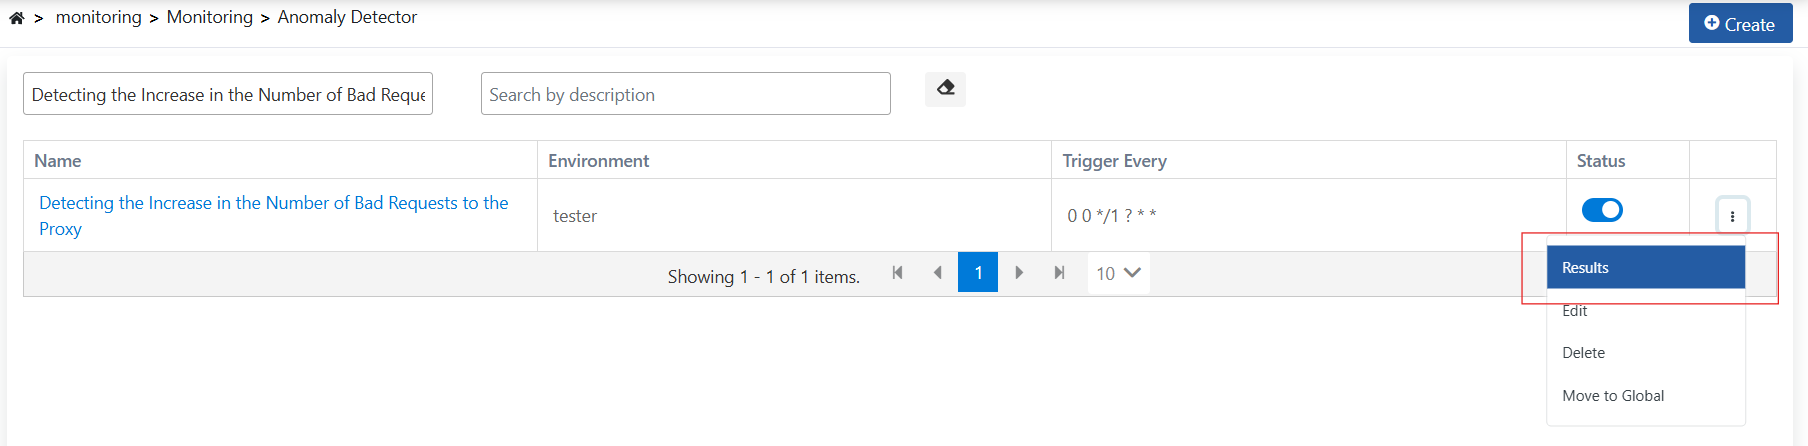
If an error has been received, it may be necessary to find the reason, or if you want to examine the general log records of the process and filter on them, the detail page of the monitor record should be visited.
Detailed information can be obtained by clicking the detail icon in the relevant log record.