Uptime Monitor Usage
Creating General Definition Information for Uptime Monitor
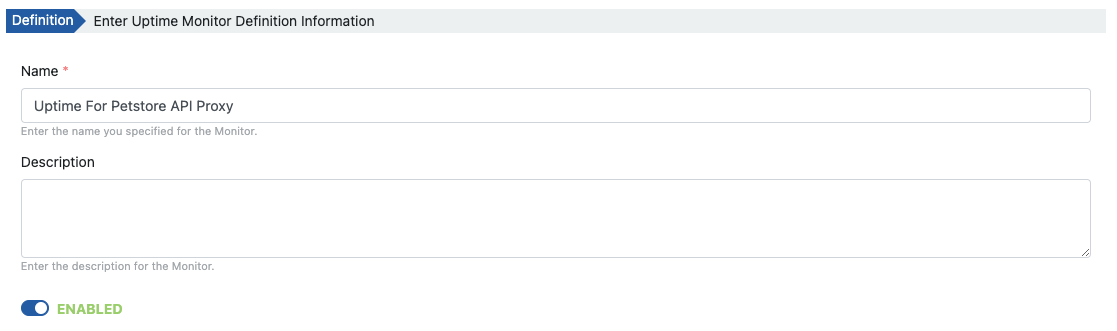
In the first stage, the identifying information of the job is entered. The most important field here is the ENABLED option. When this option is turned off, the execution of the job is suspended.
Defining Request
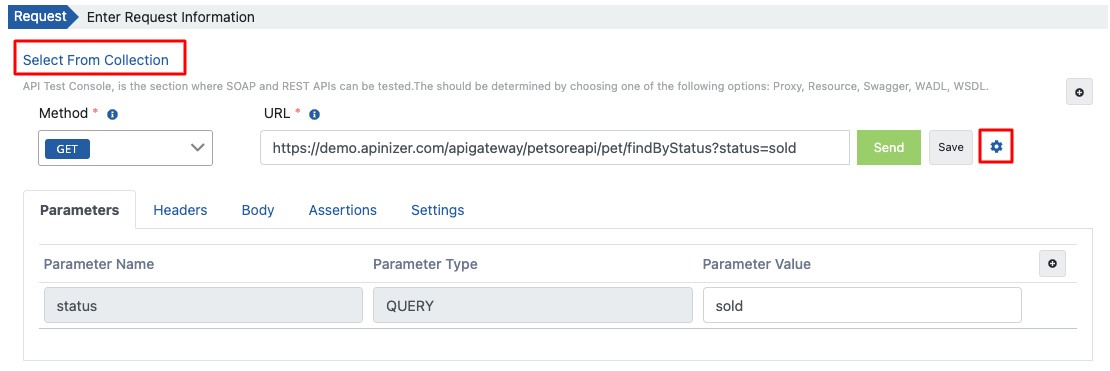
There are many ways to create the request:
- Selection can be made from requests saved in the Test Console via the Select From Collection link.
- You can create request information manually.
- By clicking the request creation button, you can select from API Proxy or API Proxy Group registered on the platform. Or you can select one of the API Definition Document types and create a request by parsing a definition file.
Verifying Request
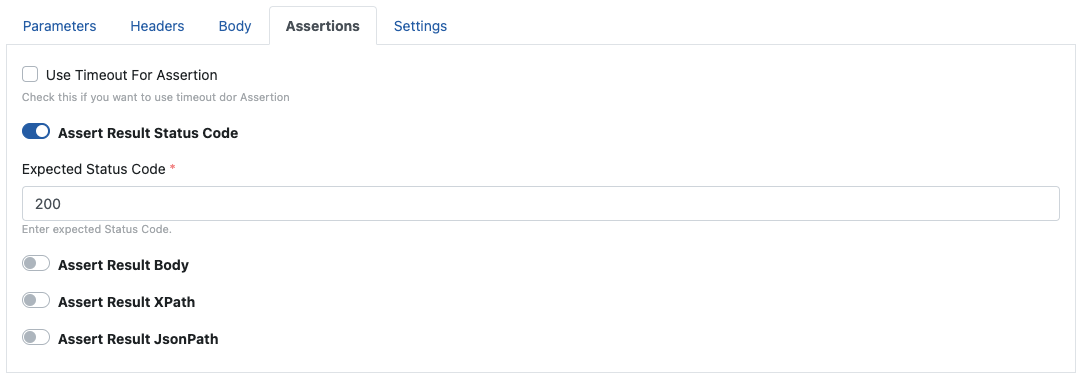
If timeout duration, status code, response body, or validation of a specific value via XPath/JSONPath on the response body can be performed in the request. To manage these features, go to the Verification tab of the request.
If the validation process in these verifications is not met, the operation result is evaluated as failed (failure).
Since it is expected that the status code of the response be 200 in this example, the following validation criterion is applied to the request.
If there is a certificate that needs to be sent in the request or if a timeout duration will be added, go to the Settings tab.
Testing Request
The request can be tested by pressing the Send button. The test result is displayed in the Response section.
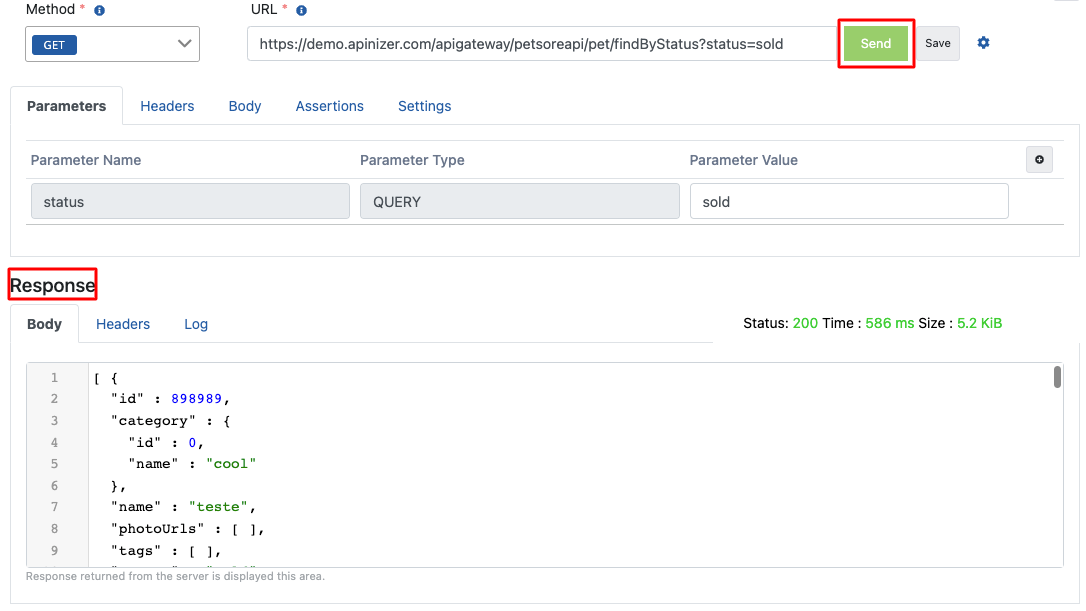
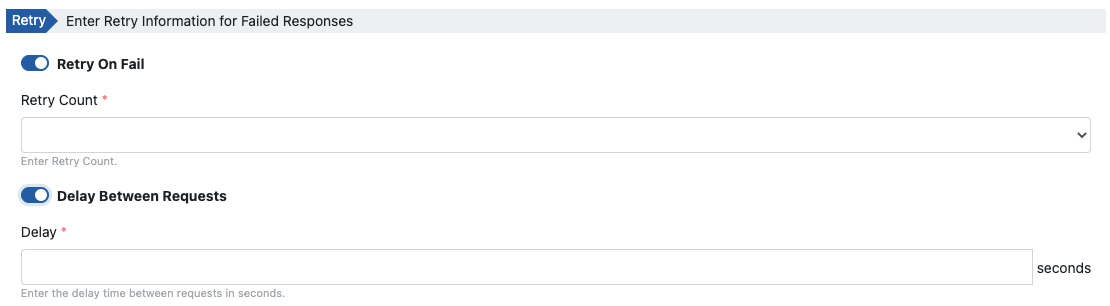
Optionally, in the Retry section, settings are made for retrying the request when a failed response is received and for the delay duration between two requests.
Defining Action
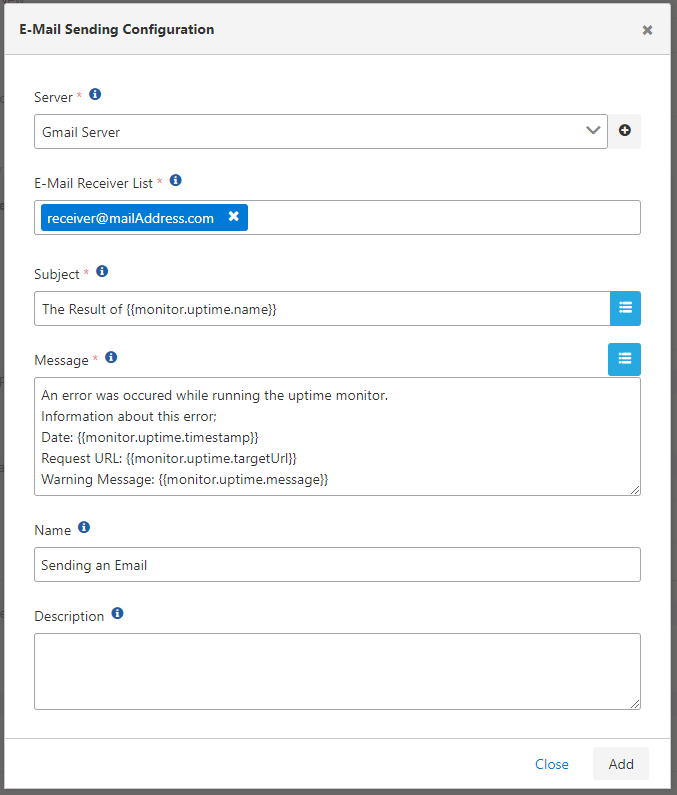
In this content, the relevant action settings are made to send an email when an error is received.
The following image explains the email sending action that contains the job result including the request address and error message when the error is received.
To get information about action types, action usage, and variables within tasks, you can refer to the Connectors page.
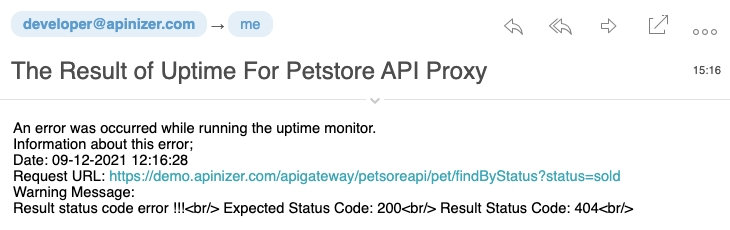
Action Result
When the action runs with an error, mail recipients encounter the content in the visual below.
Creating Job Scheduler
The defined job can be triggered and executed manually or via cron definition.
Since the job definition in this content is set to run at 1-hour intervals, the following information is seen.
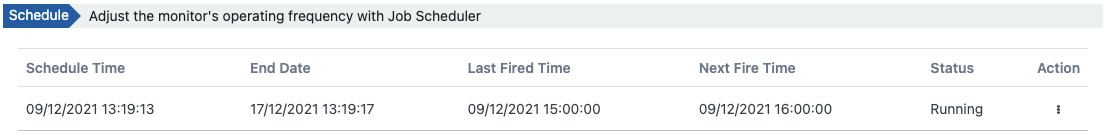
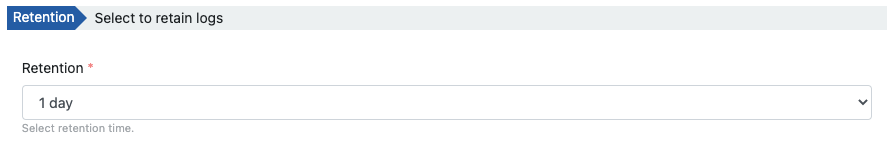
A log record is created each time a job runs. According to the retention value, these log records continue to be kept in the database.
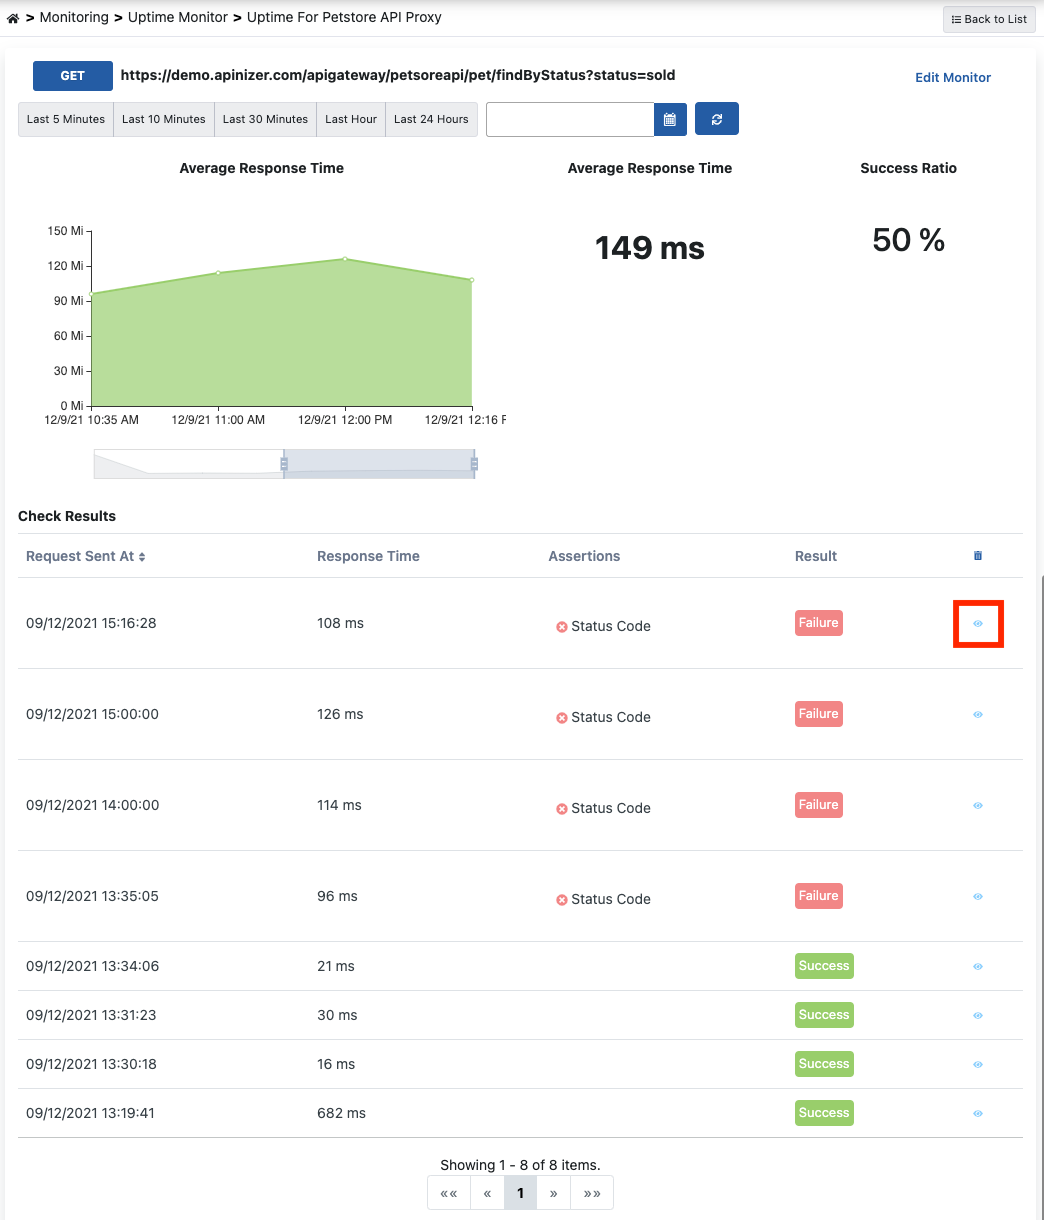
Examining Job Details
If an error has been received, it may be necessary to find the reason, or if you want to examine the general log records related to the process and filter on them, you should go to the detail page of the monitor record.
Detailed information can be obtained by clicking the detail icon in the relevant log record.