Geographic Visualization of Requests Coming to Apinizer with Kibana Maps
In this document, how to visualize on a map which cities requests come from using Kibana Maps feature with geolocation data used in Apinizer will be explained.
You can use geolocation feature in Apinizer with version 2025. To use geolocation feature, see the relevant document here.
1) Geolocation Data Provided from Apinizer
Geographic location data of incoming request in Apinizer is represented in Elasticsearch in a JSON format as follows.
{
  "toClientBody": "[]",
  "loc": {
    "lat": 41.0,
    "lon": 28.0
  }
}
Lat (latitude) and lon (longitude) values are geographic coordinates used to determine a point's location on Earth.
For example:
- Latitude: 41.0082° N, Longitude: 28.9784° E (Istanbul, Turkey)
- Latitude: 40.7128° N, Longitude: 74.0060° W (New York, USA)
2) Transferring Data to Kibana
2.1) Creating Index Pattern
In the step of transferring data to Kibana, Kibana installation and integration should be provided.** For Kibana installation, see the relevant document.
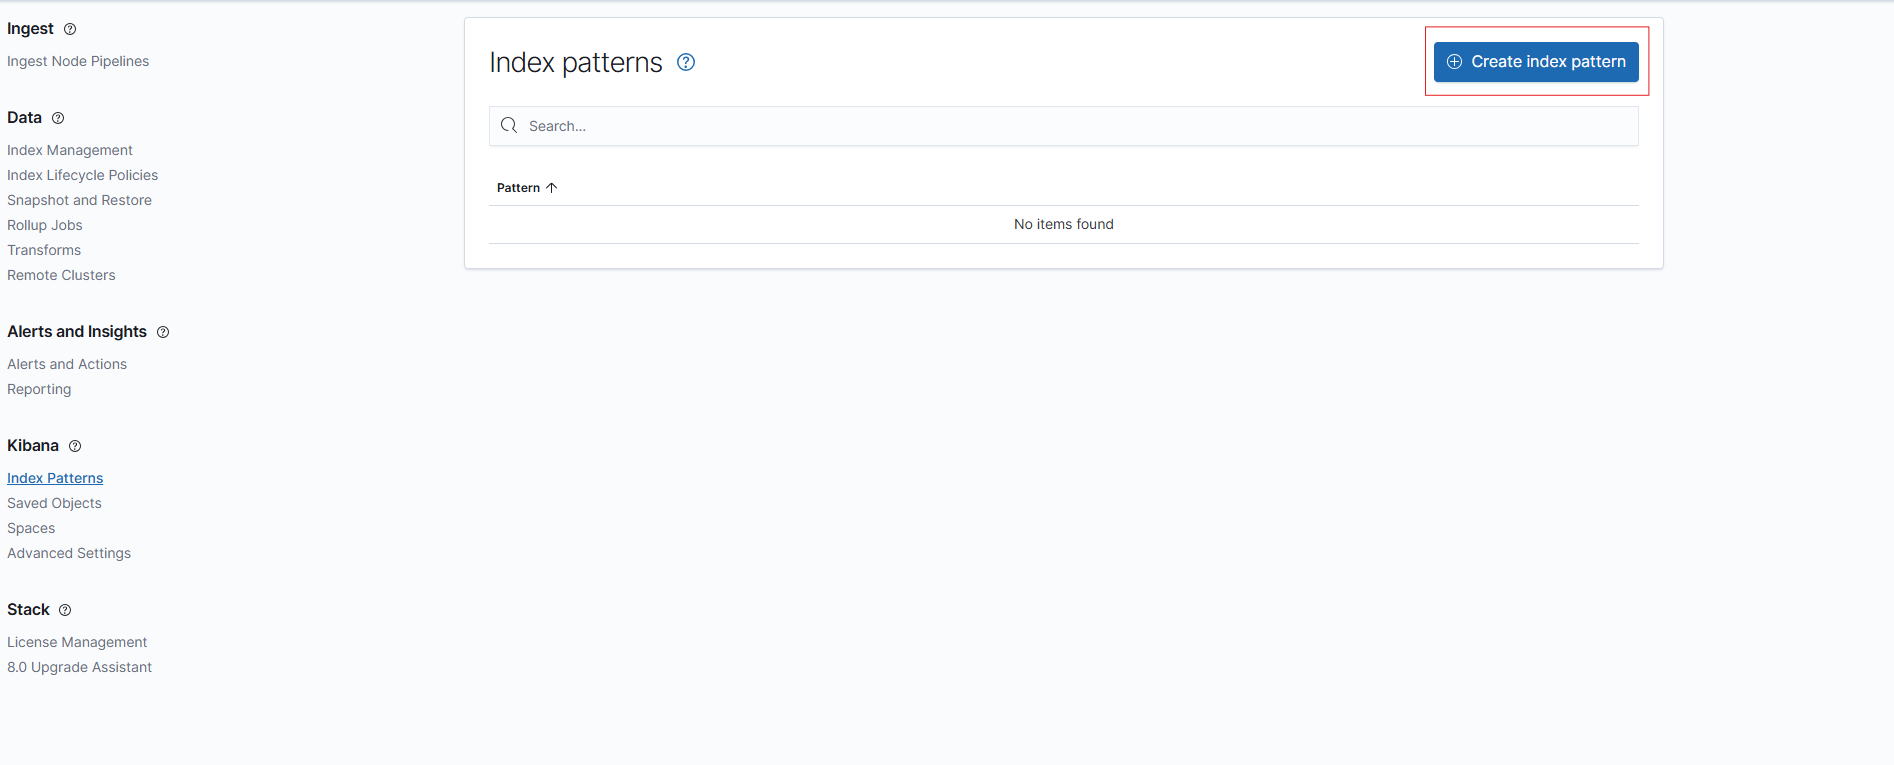
After installation, a new index pattern can be created in Kibana from 'Create Index Pattern' section on Stack Management → Index Patterns page:
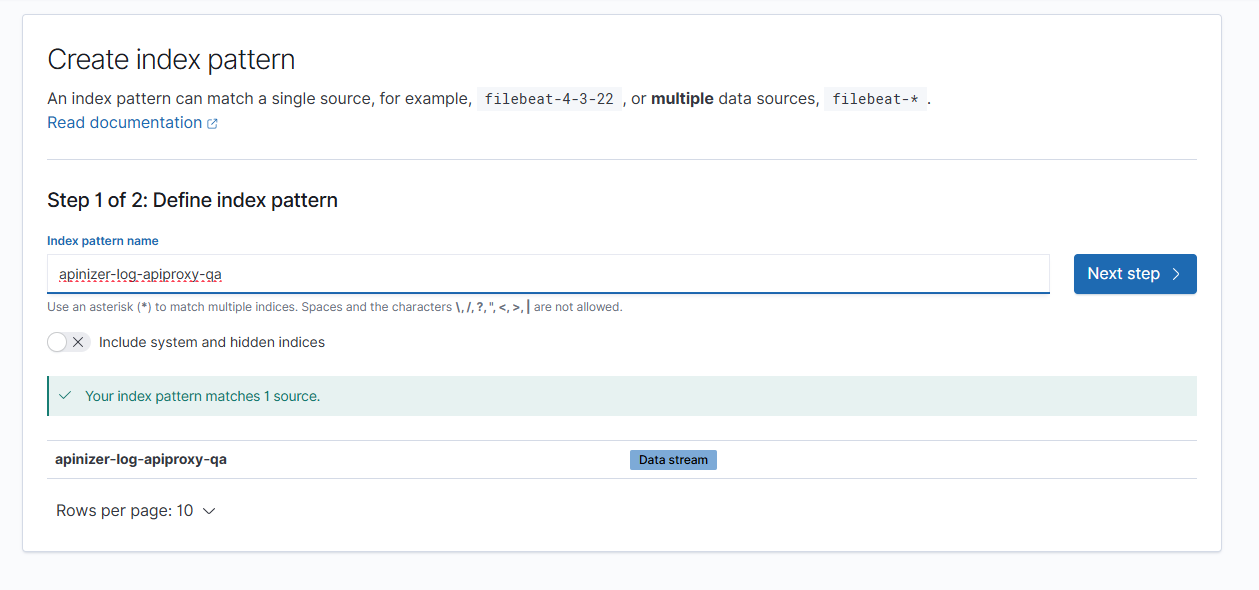
Steps are completed by selecting the data stream used in Elasticsearch and creation operation is performed:
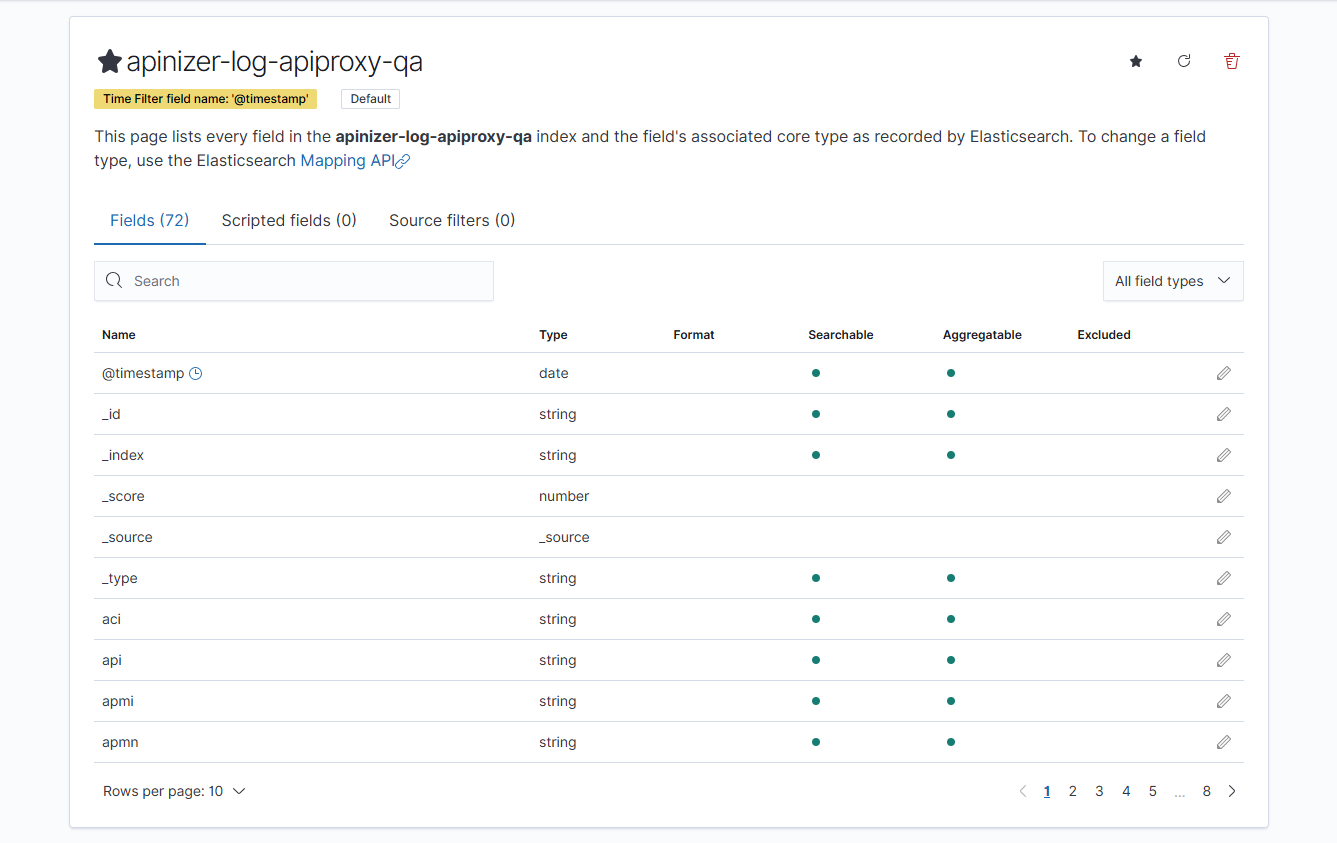
After creation operation is completed, you can see the relevant fields (fields) on the page below:
2.2) Checking Existing Index Pattern
If Kibana was previously installed and index pattern exists, refresh the index you added to Kibana from the Stack Management →Index Patterns page below. You should check that the relevant value exists by writing 'loc' in the search section.
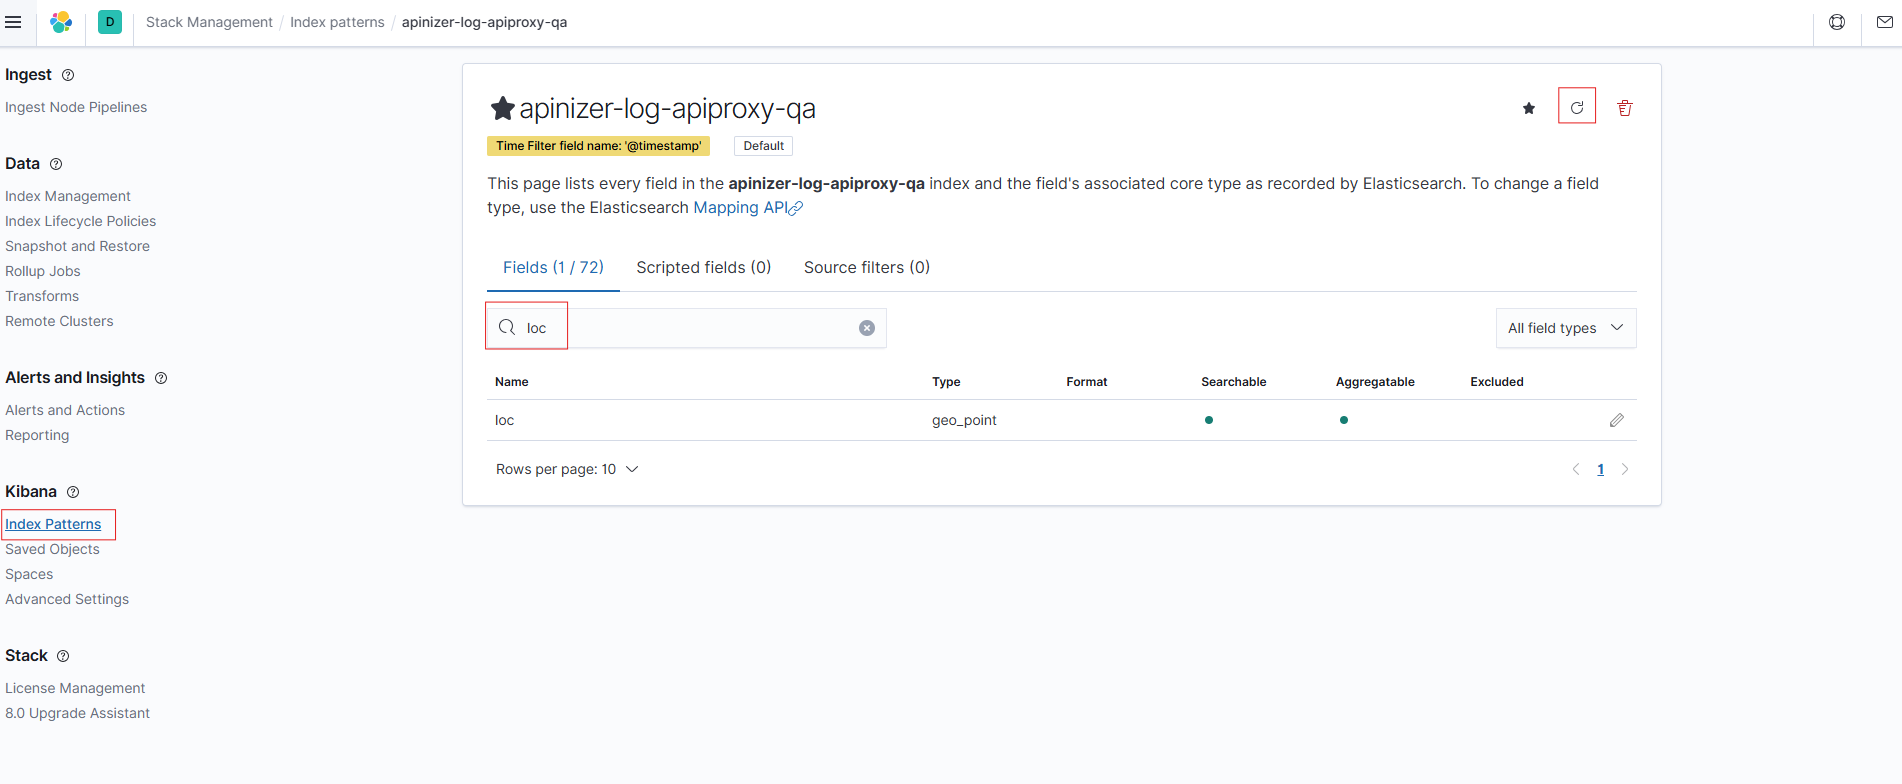
Kibana provides visualization of incoming requests on a map using this 'loc' data (latitude and longitude).
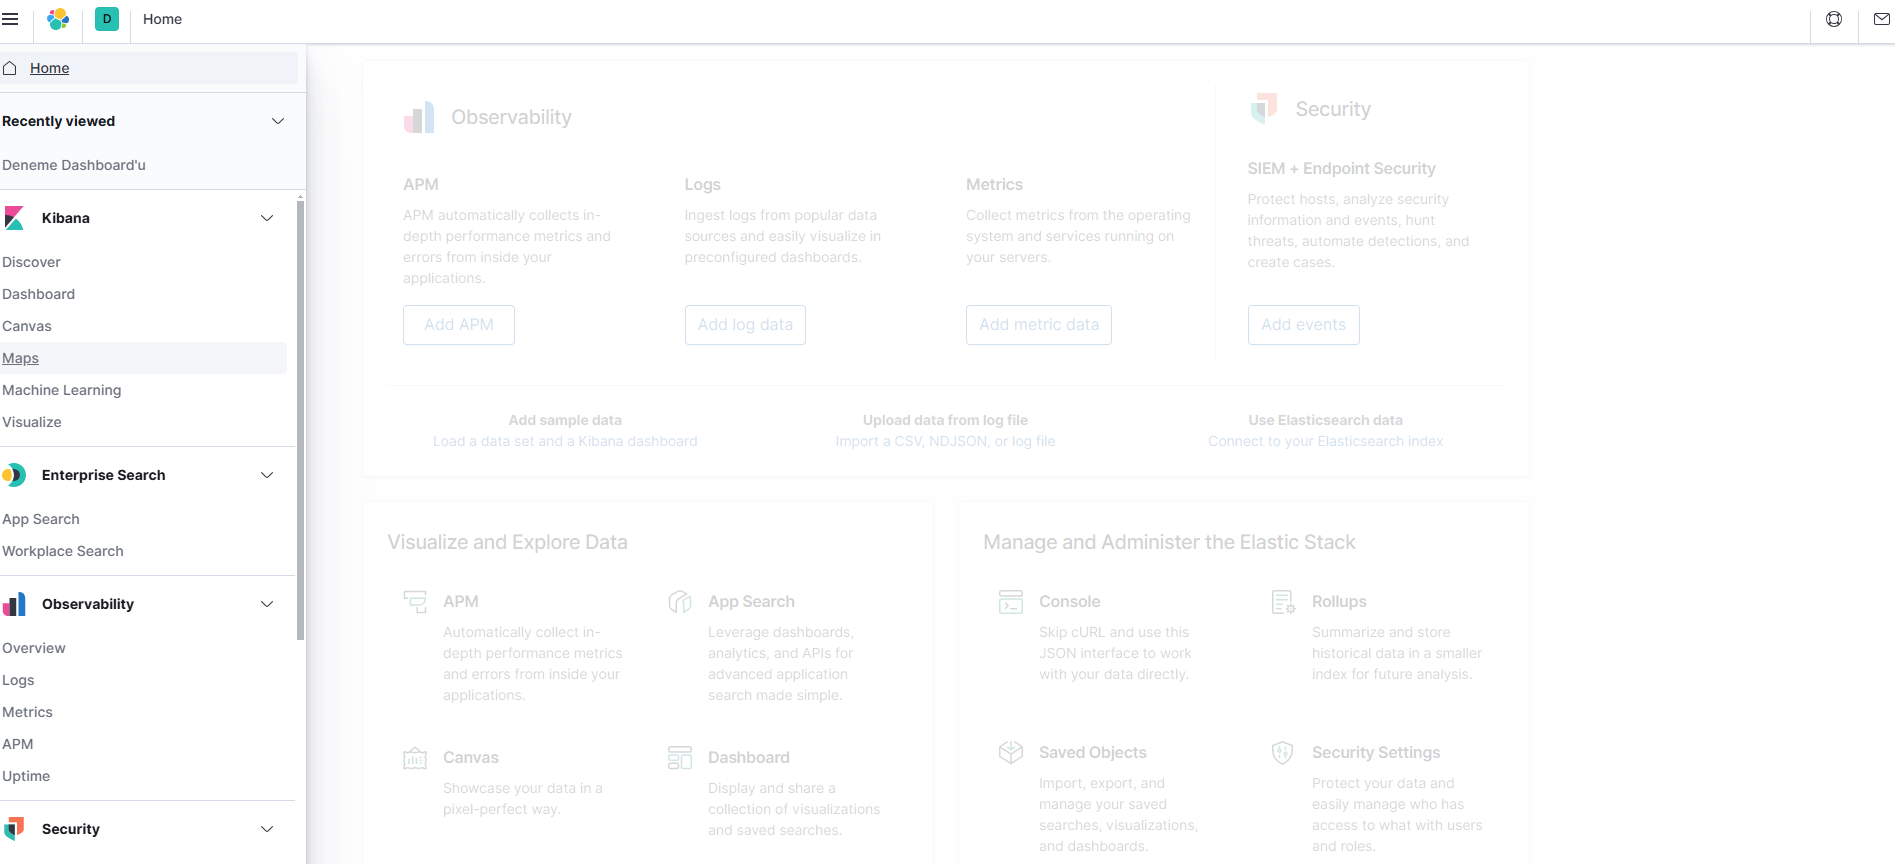
3) Adding Map Panel with Kibana Maps and Visualization
Click the "Maps" tab in the left menu on Kibana main page. This is the application you will use to create map visualizations:
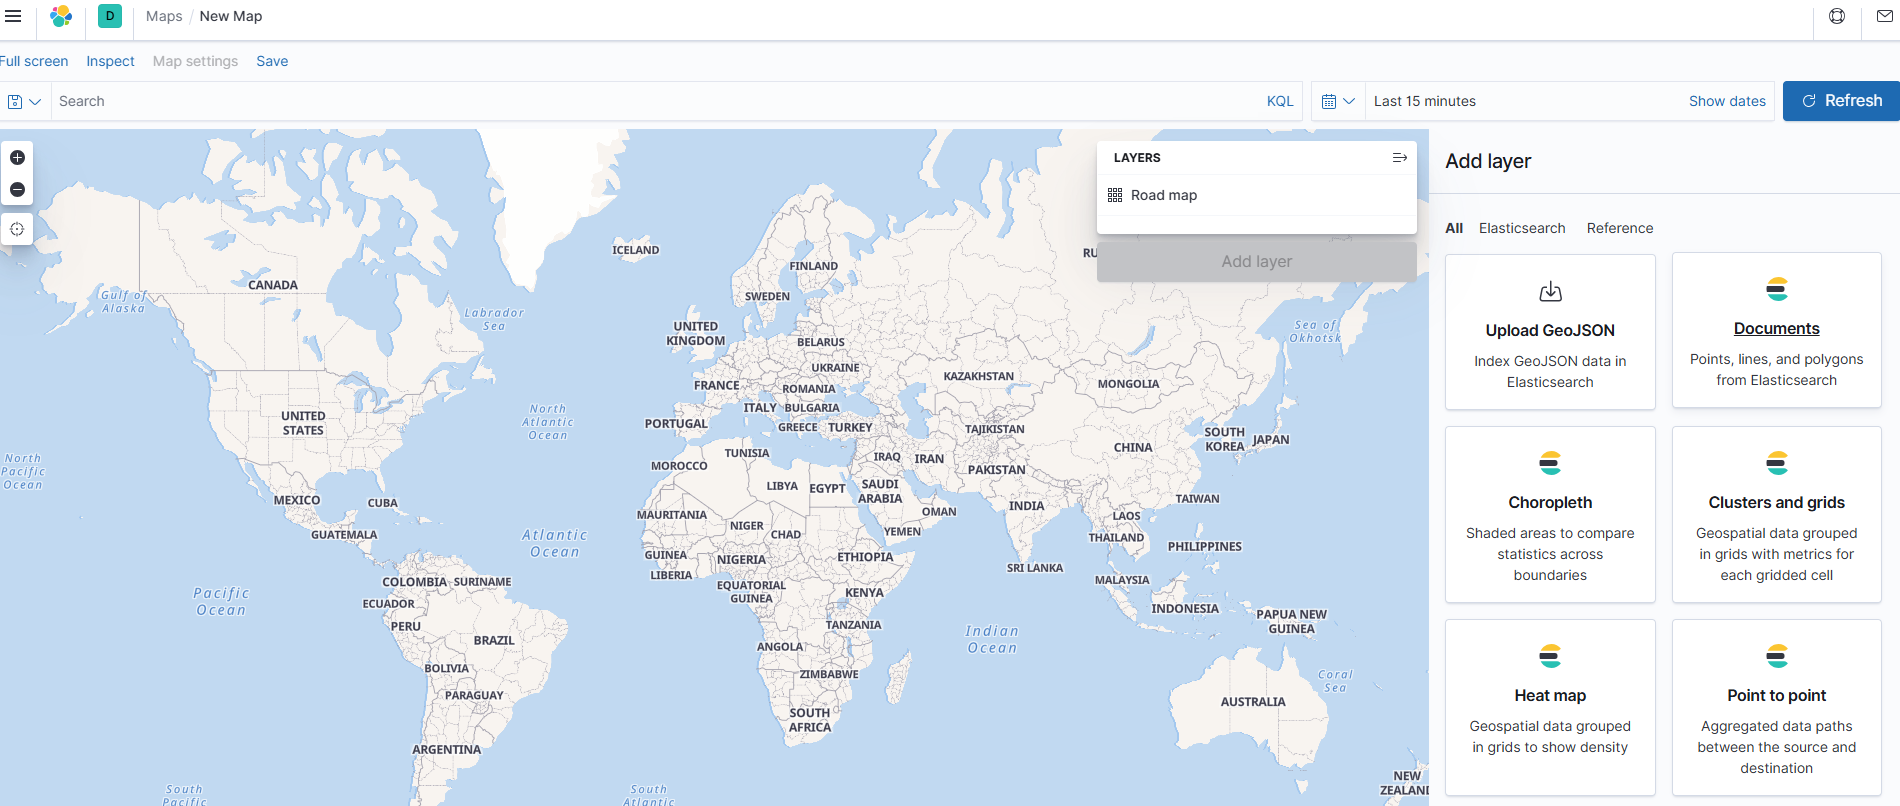
Click Add layer button. Prefer Documents option:
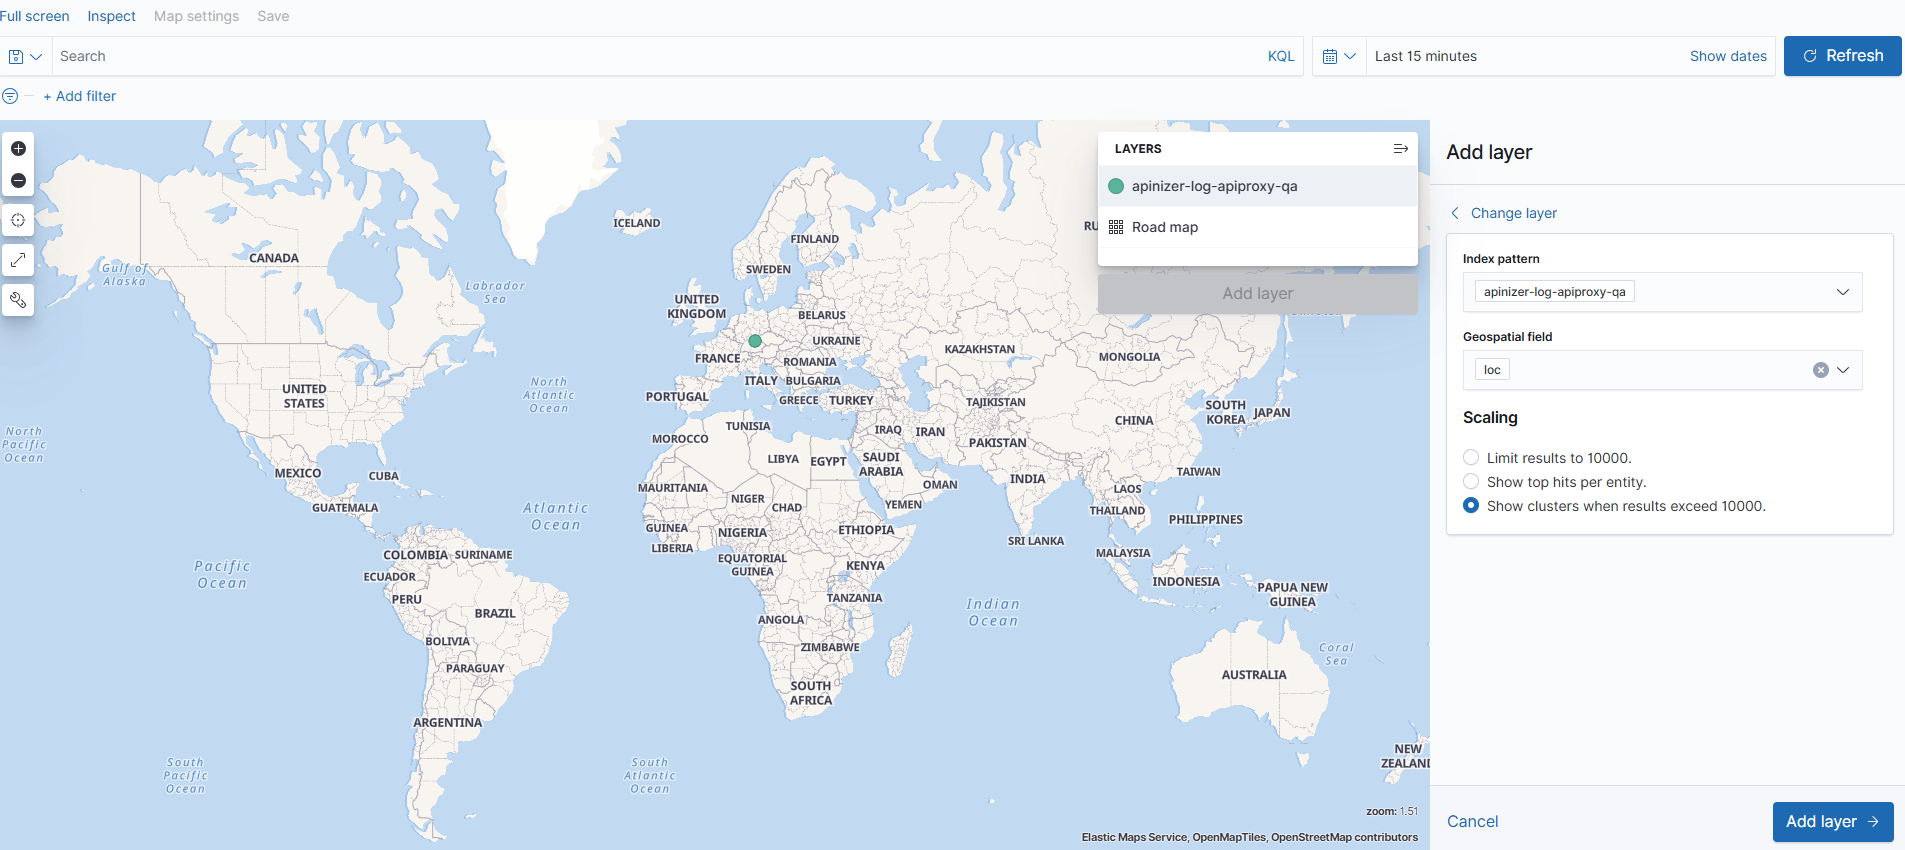
After selecting the index pattern, 'loc' field will be automatically selected. Then, you can add the layer by clicking the 'Add layer' button, name it and save:
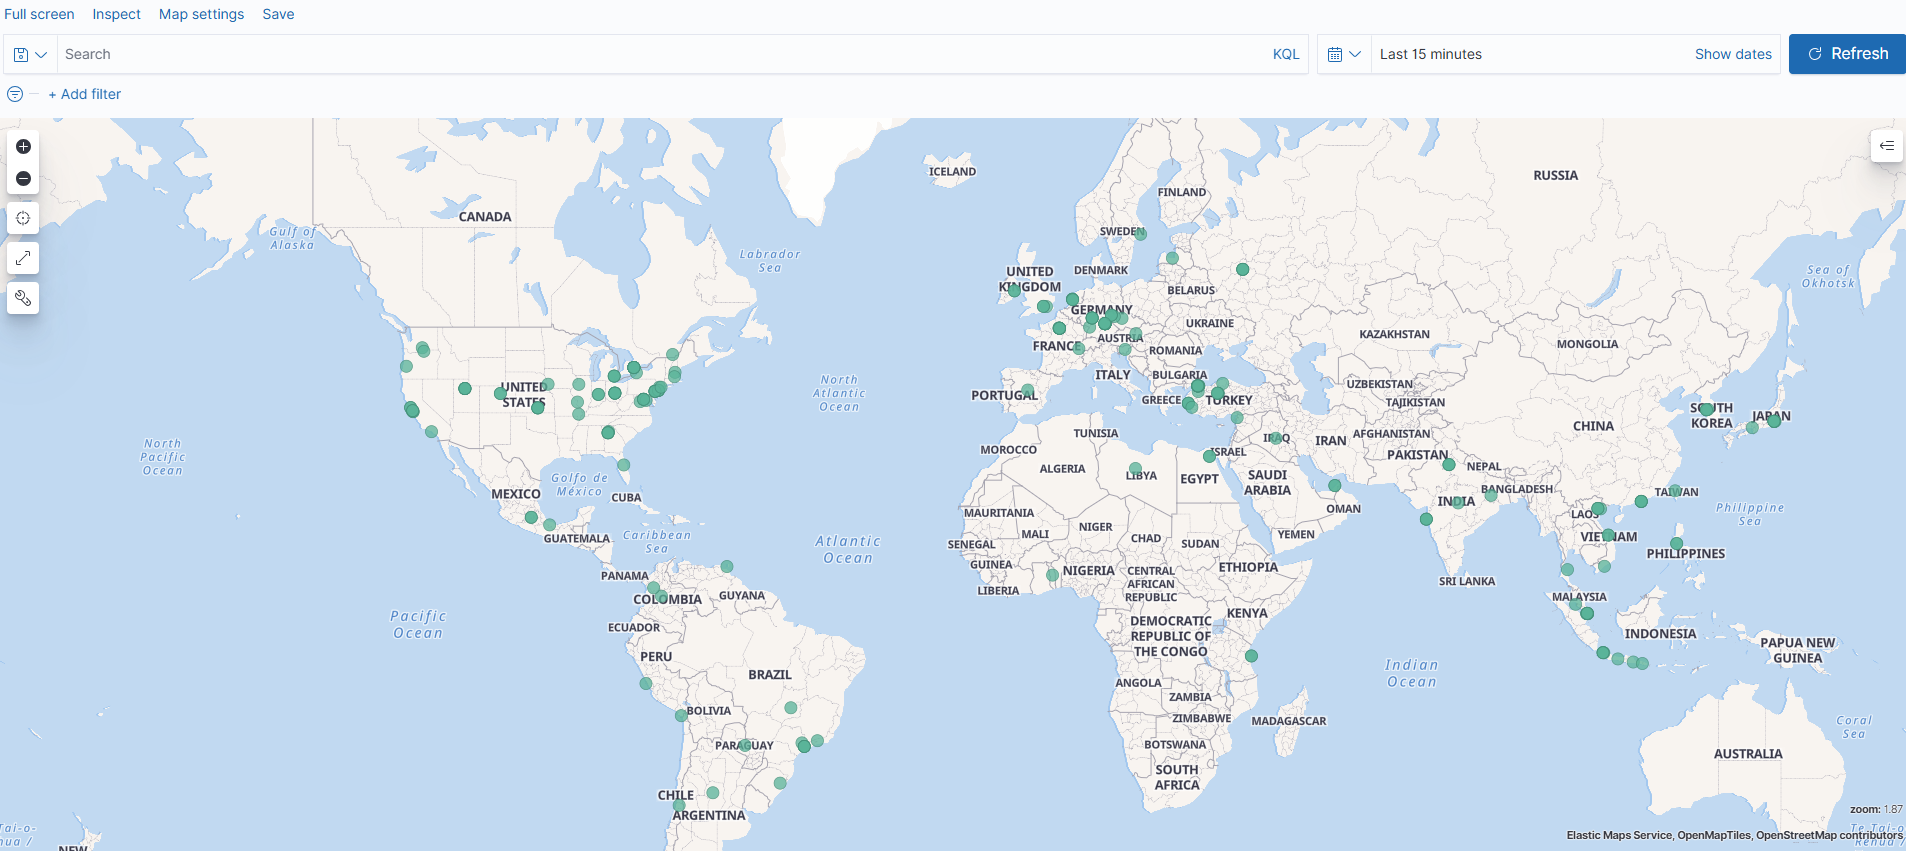
4) Result
In this document, after IP information of requests coming to Apinizer is converted to geographic data and sent to Elasticsearch, which cities requests come from has been visualized step by step using Kibana Maps.
Thanks to this structure, user accesses can be analyzed on a city basis.
Incoming requests on the map will be displayed with green markers: