Documentation Index Fetch the complete documentation index at: https://docs.apinizer.com/llms.txt
Use this file to discover all available pages before exploring further.
PROMETHEUS Prometheus is an open-source system and network monitoring tool designed for Kubernetes and microservice architectures. It collects, stores, queries, and creates graphs of performance data.
1) Prometheus Installation The environment (namespace) to work in is created:
kubectl create namespace monitoring
Role-Based Access Control (RBAC) is created:
apiVersion : rbac.authorization.k8s.io/v1 kind : ClusterRole metadata : name : prometheus rules : - apiGroups : [ "" ] resources : - nodes - nodes/proxy - services - endpoints - pods verbs : [ "get" , "list" , "watch" ] - apiGroups : - extensions resources : - ingresses verbs : [ "get" , "list" , "watch" ] - nonResourceURLs : [ "/metrics" ] verbs : [ "get" ] --- apiVersion : rbac.authorization.k8s.io/v1 kind : ClusterRoleBinding metadata : name : prometheus roleRef : apiGroup : rbac.authorization.k8s.io kind : ClusterRole name : prometheus subjects : - kind : ServiceAccount name : default namespace : monitoring
kubectl create -f clusterRole.yaml
A ConfigMap containing Prometheus configuration settings for Kubernetes is defined:
apiVersion : v1 kind : ConfigMap metadata : name : prometheus-server-conf labels : name : prometheus-server-conf namespace : monitoring data : prometheus.rules : | - groups: - name: demo alert rules rules: - alert: High Pod Memory expr: sum(container_memory_usage_bytes) > 1 for: 1m labels: severity: slack annotations: summary: High Memory Usage prometheus.yml : | - global: scrape_interval: 5s evaluation_interval: 5s rule_files: - /etc/prometheus/prometheus.rules alerting: alertmanagers: - scheme: http static_configs: - targets: - "alertmanager.monitoring.svc:9093" scrape_configs: - job_name: 'node-exporter' kubernetes_sd_configs: - role: endpoints relabel_configs: - source_labels: [__meta_kubernetes_endpoints_name] regex: 'node-exporter' action: keep - job_name: 'kubernetes-apiservers' kubernetes_sd_configs: - role: endpoints scheme: https tls_config: ca_file: /var/run/secrets/kubernetes.io/serviceaccount/ca.crt bearer_token_file: /var/run/secrets/kubernetes.io/serviceaccount/token relabel_configs: - source_labels: [__meta_kubernetes_namespace, __meta_kubernetes_service_name, __meta_kubernetes_endpoint_port_name] action: keep regex: default;kubernetes;https - job_name: 'kubernetes-nodes' scheme: https tls_config: ca_file: /var/run/secrets/kubernetes.io/serviceaccount/ca.crt bearer_token_file: /var/run/secrets/kubernetes.io/serviceaccount/token kubernetes_sd_configs: - role: node relabel_configs: - action: labelmap regex: __meta_kubernetes_node_label_(.+) - target_label: __address__ replacement: kubernetes.default.svc:443 - source_labels: [__meta_kubernetes_node_name] regex: (.+) target_label: __metrics_path__ replacement: /api/v1/nodes/${1}/proxy/metrics - job_name: 'kubernetes-pods' kubernetes_sd_configs: - role: pod relabel_configs: - source_labels: [__meta_kubernetes_pod_annotation_prometheus_io_scrape] action: keep regex: true - source_labels: [__meta_kubernetes_pod_annotation_prometheus_io_path] action: replace target_label: __metrics_path__ regex: (.+) - source_labels: [__address__, __meta_kubernetes_pod_annotation_prometheus_io_port] action: replace regex: ([^:]+)(?::\d+)?;(\d+) replacement: $1:$2 target_label: __address__ - action: labelmap regex: __meta_kubernetes_pod_label_(.+) - source_labels: [__meta_kubernetes_namespace] action: replace target_label: kubernetes_namespace - source_labels: [__meta_kubernetes_pod_name] action: replace target_label: kubernetes_pod_name - job_name: 'kube-state-metrics' static_configs: - targets: ['kube-state-metrics.kube-system.svc.cluster.local:8080'] - job_name: 'kubernetes-cadvisor' scheme: https tls_config: ca_file: /var/run/secrets/kubernetes.io/serviceaccount/ca.crt bearer_token_file: /var/run/secrets/kubernetes.io/serviceaccount/token kubernetes_sd_configs: - role: node relabel_configs: - action: labelmap regex: __meta_kubernetes_node_label_(.+) - target_label: __address__ replacement: kubernetes.default.svc:443 - source_labels: [__meta_kubernetes_node_name] regex: (.+) target_label: __metrics_path__ replacement: /api/v1/nodes/${1}/proxy/metrics/cadvisor - job_name: 'kubernetes-service-endpoints' kubernetes_sd_configs: - role: endpoints relabel_configs: - source_labels: [__meta_kubernetes_service_annotation_prometheus_io_scrape] action: keep regex: true - source_labels: [__meta_kubernetes_service_annotation_prometheus_io_scheme] action: replace target_label: __scheme__ regex: (https?) - source_labels: [__meta_kubernetes_service_annotation_prometheus_io_path] action: replace target_label: __metrics_path__ regex: (.+) - source_labels: [__address__, __meta_kubernetes_service_annotation_prometheus_io_port] action: replace target_label: __address__ regex: ([^:]+)(?::\d+)?;(\d+) replacement: $1:$2 - action: labelmap regex: __meta_kubernetes_service_label_(.+) - source_labels: [__meta_kubernetes_namespace] action: replace target_label: kubernetes_namespace - source_labels: [__meta_kubernetes_service_name] action: replace target_label: kubernetes_name
kubectl apply -f config-map.yaml
Prometheus deployment and service are created:
vi prometheus-deploy.yaml
apiVersion : apps/v1 kind : Deployment metadata : name : prometheus-deployment namespace : monitoring labels : app : prometheus-server spec : replicas : 1 selector : matchLabels : app : prometheus-server template : metadata : labels : app : prometheus-server spec : containers : - name : prometheus image : prom/prometheus args : - "--storage.tsdb.retention.time=12h" - "--config.file=/etc/prometheus/prometheus.yml" - "--storage.tsdb.path=/prometheus/" ports : - containerPort : 9090 resources : requests : cpu : 500m memory : 500M limits : cpu : 1 memory : 1Gi volumeMounts : - name : prometheus-config-volume mountPath : /etc/prometheus/ - name : prometheus-storage-volume mountPath : /prometheus/ volumes : - name : prometheus-config-volume configMap : defaultMode : 420 name : prometheus-server-conf - name : prometheus-storage-volume emptyDir : {}
vi prometheus-service.yaml
apiVersion : v1 kind : Service metadata : name : prometheus-service namespace : monitoring annotations : prometheus.io/scrape : 'true' prometheus.io/port : '9090' spec : selector : app : prometheus-server type : NodePort ports : - port : 8080 targetPort : 9090 nodePort : 30686
kubectl apply -f prometheus-deploy.yaml
kubectl apply -f prometheus-service.yaml
After creation, access to Prometheus is provided from http://<KUBERNETES_WORKER_IP_ADDRESS>:<NODE_PORT>.
2) KUBE-STATE-METRICS Installation Kube-state-metrics is used to collect information about the status of resources (e.g., pods, services, replicasets) in the Kubernetes cluster.
vi cluster-role-binding.yaml
apiVersion : rbac.authorization.k8s.io/v1 kind : ClusterRoleBinding metadata : labels : app.kubernetes.io/component : exporter app.kubernetes.io/name : kube-state-metrics app.kubernetes.io/version : 2.3.0 name : kube-state-metrics roleRef : apiGroup : rbac.authorization.k8s.io kind : ClusterRole name : kube-state-metrics subjects : - kind : ServiceAccount name : kube-state-metrics namespace : kube-system
apiVersion : rbac.authorization.k8s.io/v1 kind : ClusterRole metadata : labels : app.kubernetes.io/component : exporter app.kubernetes.io/name : kube-state-metrics app.kubernetes.io/version : 2.3.0 name : kube-state-metrics rules : - apiGroups : - "" resources : - configmaps - secrets - nodes - pods - services - resourcequotas - replicationcontrollers - limitranges - persistentvolumeclaims - persistentvolumes - namespaces - endpoints verbs : - list - watch - apiGroups : - apps resources : - statefulsets - daemonsets - deployments - replicasets verbs : - list - watch - apiGroups : - batch resources : - cronjobs - jobs verbs : - list - watch - apiGroups : - autoscaling resources : - horizontalpodautoscalers verbs : - list - watch - apiGroups : - authentication.k8s.io resources : - tokenreviews verbs : - create - apiGroups : - authorization.k8s.io resources : - subjectaccessreviews verbs : - create - apiGroups : - policy resources : - poddisruptionbudgets verbs : - list - watch - apiGroups : - certificates.k8s.io resources : - certificatesigningrequests verbs : - list - watch - apiGroups : - storage.k8s.io resources : - storageclasses - volumeattachments verbs : - list - watch - apiGroups : - admissionregistration.k8s.io resources : - mutatingwebhookconfigurations - validatingwebhookconfigurations verbs : - list - watch - apiGroups : - networking.k8s.io resources : - networkpolicies - ingresses verbs : - list - watch - apiGroups : - coordination.k8s.io resources : - leases verbs : - list - watch
kubectl apply -f cluster-role-binding.yaml
kubectl apply -f cluster-role.yaml
vi metrics-deployment.yaml
apiVersion : apps/v1 kind : Deployment metadata : labels : app.kubernetes.io/component : exporter app.kubernetes.io/name : kube-state-metrics app.kubernetes.io/version : 2.3.0 name : kube-state-metrics namespace : kube-system spec : replicas : 1 selector : matchLabels : app.kubernetes.io/name : kube-state-metrics template : metadata : labels : app.kubernetes.io/component : exporter app.kubernetes.io/name : kube-state-metrics app.kubernetes.io/version : 2.3.0 spec : automountServiceAccountToken : true containers : - image : k8s.gcr.io/kube-state-metrics/kube-state-metrics:v2.3.0 livenessProbe : httpGet : path : /healthz port : 8080 initialDelaySeconds : 5 timeoutSeconds : 5 name : kube-state-metrics ports : - containerPort : 8080 name : http-metrics - containerPort : 8081 name : telemetry readinessProbe : httpGet : path : / port : 8081 initialDelaySeconds : 5 timeoutSeconds : 5 securityContext : allowPrivilegeEscalation : false readOnlyRootFilesystem : true runAsUser : 65534 nodeSelector : kubernetes.io/os : linux serviceAccountName : kube-state-metrics
kubectl apply -f metrics-deployment.yaml
apiVersion : v1 automountServiceAccountToken : false kind : ServiceAccount metadata : labels : app.kubernetes.io/component : exporter app.kubernetes.io/name : kube-state-metrics app.kubernetes.io/version : 2.3.0 name : kube-state-metrics namespace : kube-system
vi kube-state-metric-service.yaml
apiVersion : v1 kind : Service metadata : labels : app.kubernetes.io/component : exporter app.kubernetes.io/name : kube-state-metrics app.kubernetes.io/version : 2.3.0 name : kube-state-metrics namespace : kube-system spec : clusterIP : None ports : - name : http-metrics port : 8080 targetPort : http-metrics - name : telemetry port : 8081 targetPort : telemetry selector : app.kubernetes.io/name : kube-state-metrics
kubectl apply -f service-account.yaml
kubectl apply -f kube-state-metric-service.yaml
For detailed information , you can review Prometheus’s own documentation page: https://prometheus.io/docs/introduction/overview/
3) Grafana Installation Grafana is an open-source data visualization web application. You can connect to various data sources and display your data in charts and graphs and interpret it more easily.
Grafana installation on Ubuntu operating systems is described below. Deployment configuration can be used for Grafana installation on Kubernetes.
sudo wget -q -O - https://packages.grafana.com/gpg.key | sudo apt-key add -
echo "deb https://packages.grafana.com/oss/deb stable main" | sudo tee /etc/apt/sources.list.d/grafana.list
sudo apt update
sudo apt-get install -y grafana
sudo systemctl start grafana-server
sudo systemctl status grafana-server
sudo systemctl enable grafana-server
After installation is completed, access is provided from http://<SERVER_IP_ADDRESS>:3000.
Default login information for Grafana:
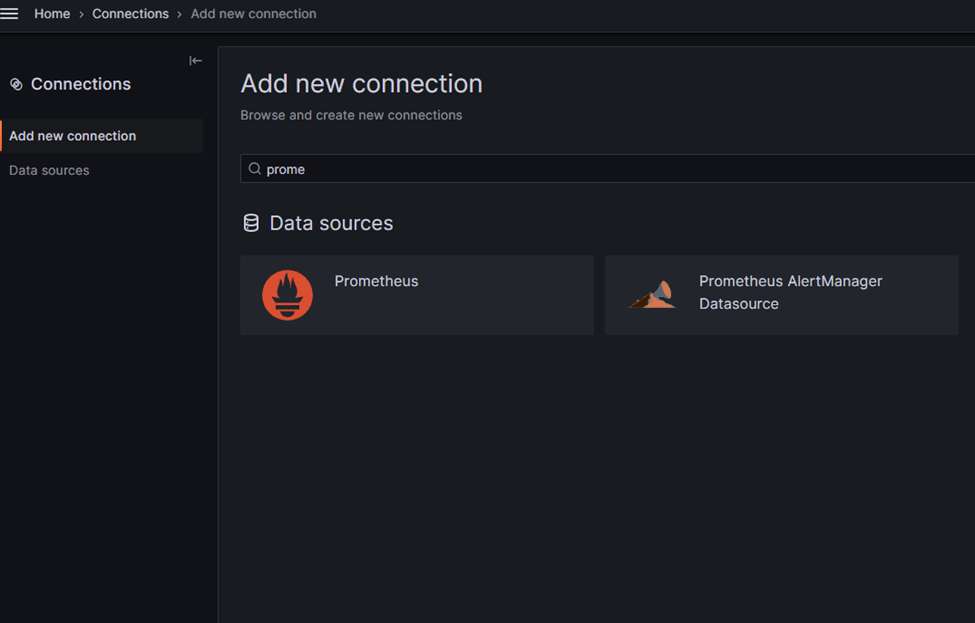
username: adminpassword: admin 4) Adding Prometheus Connection in Grafana A Prometheus connection information is added from the left menu.
Prometheus is selected. By clicking the “Add new data source” option, the Prometheus server URL information is entered and the connection is saved.
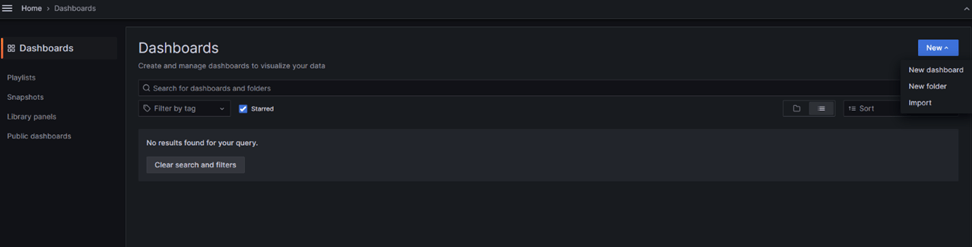
Click the “Dashboard” tab from the left menu. Then, a new import process is started with the “New” option.
Add numbers 315 and 13498 to the ID field respectively. Click the Load button. Select the Prometheus connection where the Dashboard will run and save with the “Import” option.
Dashboard ID: 315 Visually presents information such as CPU usage, memory usage, and network transaction intensity in your cluster and nodes.
Dashboard ID: 13498 Visually presents CPU usage, memory usage, and network transaction intensity information at namespace, pod, and container levels.
For detailed information , you can review Grafana’s own documentation page: https://grafana.com/docs/grafana/latest/