In today's microservice architecture, monitoring system performance and behavior is vital to maintain optimal operations. Apinizer, a powerful API management platform, offers robust metric collection features that can be integrated with industry-standard monitoring tools like Prometheus and Grafana. This article provides a detailed guide on how you can benefit from Apinizer's metric features to gain valuable insights about your API gateway and cache performance.
Overview of Apinizer's Metric System
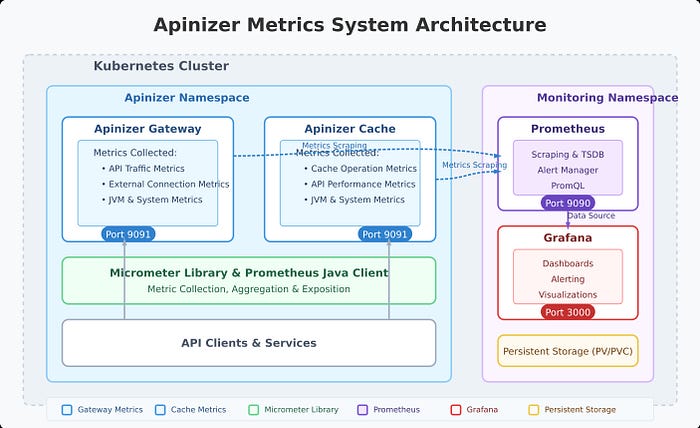
Apinizer's metric system is built on Micrometer. The platform collects a wide range of metrics through two main components:
- Apinizer Gateway: Collects metrics related to API traffic, external connections, JVM health, and system resources
- Apinizer Cache: Monitors cache operations, API requests, JVM performance, and system health
These metrics provide comprehensive visibility into the performance and health of your API management infrastructure, enabling proactive identification of bottlenecks, troubleshooting, and capacity planning.
Metrics Collected by Apinizer
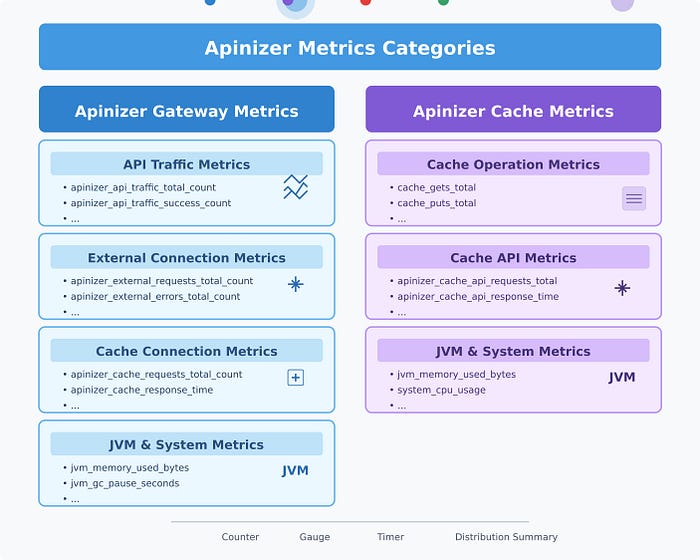
Apinizer Gateway Metrics
Gateway component collects metrics in various categories:
API Traffic Metrics
These metrics track requests passing through Apinizer Gateway:
- Total API traffic requests
- Successful/failed/blocked API requests
- Request processing times (pipeline, routing, total)
- Request and response sizes
- Cache hit statistics
Each metric is available in two forms:
- Total metrics (e.g., total API requests across all APIs)
- Tagged metrics with detailed dimensions (e.g., requests per API ID, API name)
External Connection Metrics
These track connections made to external services:
- Total external requests
- External error count
- External response times
JVM Metrics
These provide insights about Java Virtual Machine:
- Memory usage (heap, non-heap)
- Garbage collection statistics
- Thread counts and states
System Metrics
These monitor the underlying system:
- CPU usage
- Processor count
- System load average
- File descriptor counts
Apinizer Cache Metrics
Cache component collects:
Cache Operation Metrics
- Cache get/put counts
- Cache size and entry counts
- Cache operation latencies
- Memory usage by cache entries
API Metrics
- API request counts
- API response times
- API error counts
JVM and System Metrics
Similar to Gateway, Cache component also tracks JVM performance and system resource usage.
Setting Up Prometheus Integration
1. Enabling Metrics in Apinizer Components
For Apinizer Gateway:
Edit the worker deployment and add the METRICS_ENABLED=true environment variable. The container spec also needs port 9091 to be added.
# Add the environment variable
kubectl -n <namespace> set env deployment/worker METRICS_ENABLED=true

# Add container port 9091
kubectl -n <namespace> patch deployment worker --type=json -p='[
  {
    "op": "add",
    "path": "/spec/template/spec/containers/0/ports/-",
    "value": {"containerPort": 9091, "name": "metrics", "protocol": "TCP"}
  }
]'
For Apinizer Cache:
Edit the cache deployment and add the METRICS_ENABLED=true environment variable.
Through the Kubernetes CLI:
kubectl edit deploy -n <namespace> cache
# Add the following environment variable
- name: METRICS_ENABLED
  value: "true"
2. Configuring Prometheus to Collect Metrics
You can configure Prometheus to collect metrics from Apinizer components in two different ways:
Constant Scraping
Create a service targeting Apinizer components on port 9091:
apiVersion: v1
kind: Service
metadata:
  name: cache-prometheus-service  # or gateway-prometheus-service
  namespace: <NAMESPACE>
spec:
  ports:
    - name: metrics
      port: 9091
      protocol: TCP
      targetPort: 9091
  selector:
    app: cache  # or worker for Gateway
  type: ClusterIP
Then configure Prometheus to collect metrics from these services:
scrape_configs:
  - job_name: 'apinizer-components'
    static_configs:
      - targets: ['cache-prometheus-service.<NAMESPACE>.svc.cluster.local:9091', 'worker-prometheus-service.<NAMESPACE>.svc.cluster.local:9091']
Dynamic Scraping with Kubernetes Service Discovery
For more flexible configurations, you can use Kubernetes service discovery with pod annotations:
- Add annotations to Deployment:
template:
  metadata:
    annotations:
      prometheus.io/port: "9091"
      prometheus.io/scrape: "true"
- Configure Prometheus to use Kubernetes service discovery:
scrape_configs:
  - job_name: 'kubernetes-pods'
    kubernetes_sd_configs:
      - role: pod
    relabel_configs:
      - source_labels: [__meta_kubernetes_pod_annotation_prometheus_io_scrape]
        action: keep
        regex: true
      - source_labels: [__meta_kubernetes_pod_annotation_prometheus_io_port, __meta_kubernetes_pod_ip]
        action: replace
        regex: (\d+);((([0-9]+?)(\.|$)){4})
        replacement: $2:$1
        target_label: __address__
      # Additional relabeling configurations...
Analyzing Apinizer Metrics with PromQL
After Prometheus starts collecting metrics from Apinizer components, you can use PromQL (Prometheus Query Language) to analyze the data. Here are some useful query examples:
Gateway API Traffic Analysis
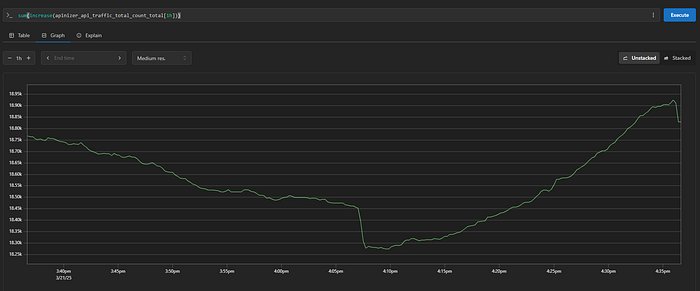
# Total API request rate in last 5 minutes
sum(rate(apinizer_api_traffic_total_count_total[5m]))
# Success rate (%)
(sum(rate(apinizer_api_traffic_success_count_total[5m])) / sum(rate(apinizer_api_traffic_total_count_total[5m]))) * 100
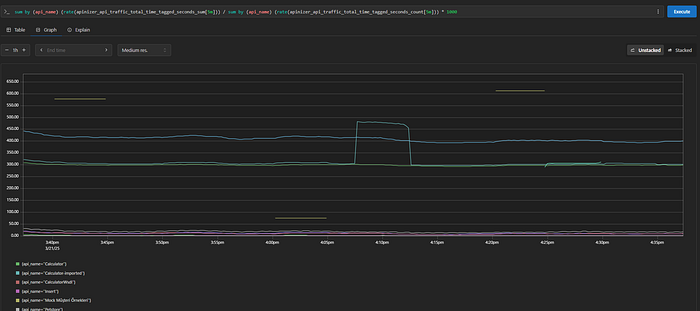
# Average response time (milliseconds)
(sum(rate(apinizer_api_traffic_total_time_tagged_seconds_sum[5m])) / sum(rate(apinizer_api_traffic_total_time_tagged_seconds_count[5m]))) * 1000
Cache Performance Analysis
# Total cache get operations in last hour
sum(increase(cache_gets_total[1h]))

# Cache hit rate (%)
(sum(increase(cache_gets_total[5m])) - sum(increase(apinizer_cache_api_errors_total[5m]))) / sum(increase(cache_gets_total[5m])) * 100

# Current cache entries
sum(cache_size)
JVM Analysis
# Memory usage (%)
(sum(jvm_memory_used_bytes{application="apinizer-cache"}) * 100) / sum(jvm_memory_max_bytes{application="apinizer-cache"})

# Garbage collection time
sum(rate(jvm_gc_pause_seconds_sum[5m]))
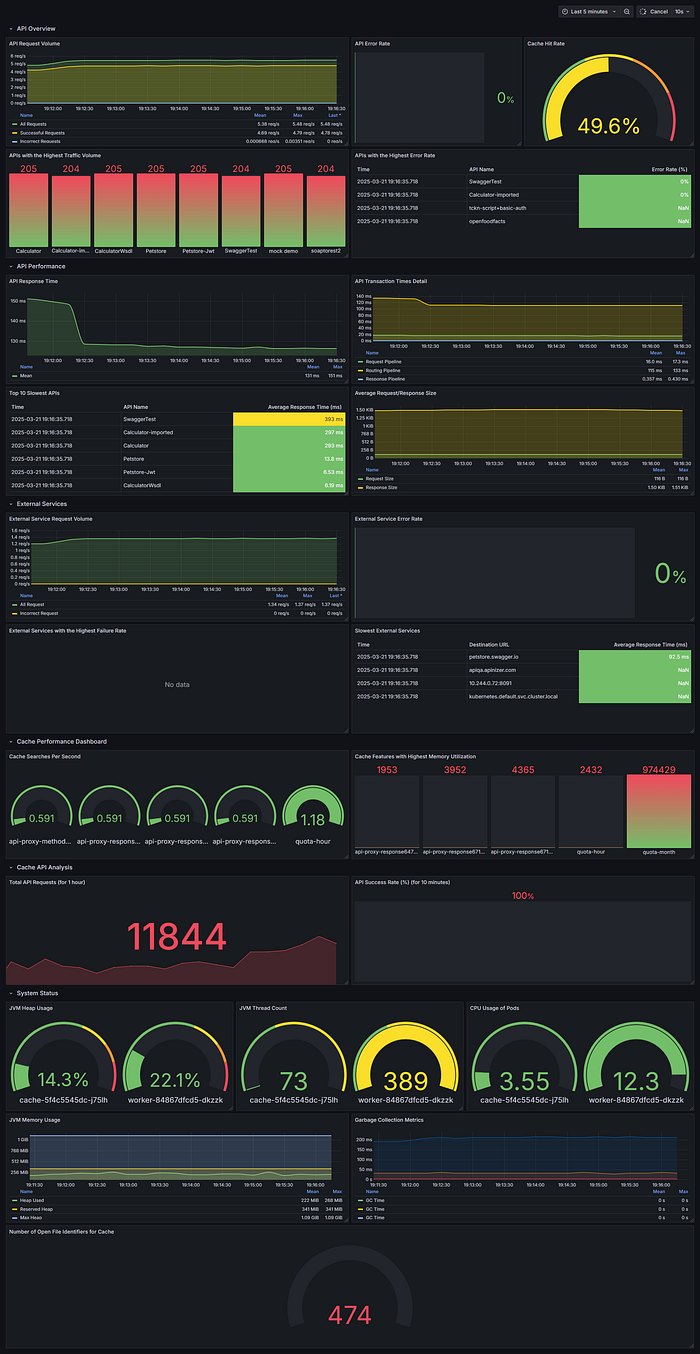
Creating Grafana Dashboards
After setting Prometheus as data source in Grafana, you can create dashboards to visualize Apinizer metrics. Here are some panel suggestions:
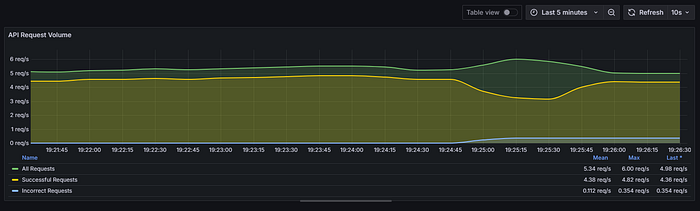
API Traffic Dashboard
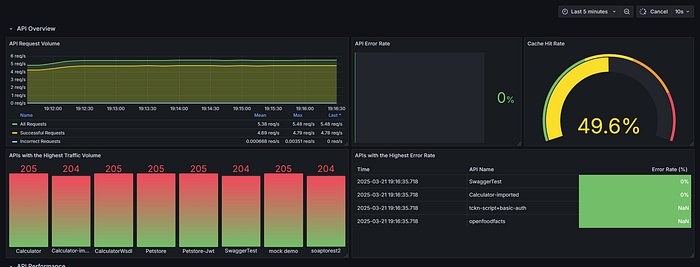
Panel 1: API Request Volume by Type
- Metrics:
- Total requests:
sum(rate(apinizer_api_traffic_total_count_total[5m])) - Successful requests:
sum(rate(apinizer_api_traffic_success_count_total[5m])) - Failed requests:
sum(rate(apinizer_api_traffic_error_count_total[5m])) - Visualization: Time series
Panel 2: Most Used APIs by Traffic
- Metric:
topk(5, sum by (api_name) (increase(apinizer_api_traffic_total_count_tagged_total[5m]))) - Visualization: Bar chart
Panel 3: API Processing Time Distribution
- Metrics:
- Request pipeline:
sum(rate(apinizer_api_traffic_request_pipeline_time_seconds_sum[5m])) / sum(rate(apinizer_api_traffic_request_pipeline_time_seconds_count[5m])) * 1000 - Routing:
sum(rate(apinizer_api_traffic_routing_time_seconds_sum[5m])) / sum(rate(apinizer_api_traffic_routing_time_seconds_count[5m])) * 1000 - Response pipeline:
sum(rate(apinizer_api_traffic_response_pipeline_time_seconds_sum[5m])) / sum(rate(apinizer_api_traffic_response_pipeline_time_seconds_count[5m])) * 1000 - Visualization: Time series
Panel 4: Request/Response Size
- Metrics:
- Request size:
sum(rate(apinizer_api_traffic_request_size_bytes_sum[5m])) / sum(rate(apinizer_api_traffic_request_size_bytes_count[5m])) - Response size:
sum(rate(apinizer_api_traffic_response_size_bytes_sum[5m])) / sum(rate(apinizer_api_traffic_response_size_bytes_count[5m])) - Visualization: Time series
Cache Performance Dashboard
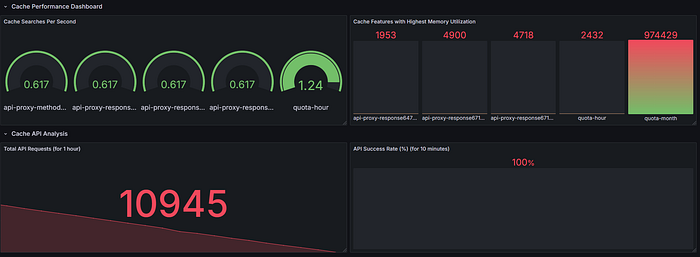
Panel 1: Cache Operations
- Metrics:
- Get operations:
rate(cache_gets_total[5m]) - Put operations:
rate(cache_puts_total[5m]) - Visualization: Time series
Panel 2: Cache Hit Rate
- Metric:
(sum(increase(cache_gets_total[5m])) -sum(increase(apinizer_cache_api_errors_total[5m]))) / sum(increase(cache_gets_total[5m])) * 100 - Visualization: Gauge
Panel 3: Cache Memory Usage
- Metric:
sum(cache_entry_memory_bytes) - Visualization: Stat or gauge
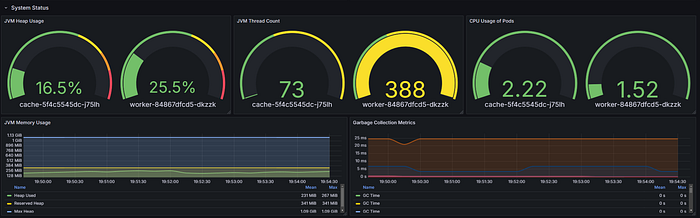
System Health Dashboard
Panel 1: JVM Memory Usage
- Metric:
sum by (area)(jvm_memory_used_bytes) / sum by (area)(jvm_memory_max_bytes) * 100 - Visualization: Gauge or time series
Panel 2: CPU Usage
- Metric:
sum(system_cpu_usage{pod=~".*"}) by (pod) * 100 - Visualization: Time series
Panel 3: Active Threads
- Metric:
sum(jvm_threads_live_threads) - Visualization: Stat or gauge
Best Practices
1. Metric Retention Duration
Configure appropriate retention durations in Prometheus according to your needs. Default configuration stores data for 7 days:
- "--storage.tsdb.path=/prometheus"
- "--storage.tsdb.retention.time=7d"
Consider remote storage integrations or adjust these values for longer retention.
2. Alarm Configuration
Set up alarms for critical metrics in Prometheus AlertManager or Grafana:
- High API error rates:
(sum(increase(apinizer_api_traffic_error_count_total[5m])) / sum(increase(apinizer_api_traffic_total_count_total[5m]))) * 100 > 10 - High memory usage:
sum(jvm_memory_used_bytes) / sum(jvm_memory_max_bytes) * 100 > 85 - Slow response times:
sum(rate(apinizer_api_traffic_total_time_seconds_sum[5m])) / sum(rate(apinizer_api_traffic_total_time_seconds_count[5m])) > 1
3. Dashboard Organization
Organize your Grafana dashboards logically:
- Create separate dashboards for Gateway and Cache components
- Bring related metrics together
- Use variables that allow filtering by namespace, pod, or API
4. Label Usage
Take advantage of Prometheus labels for more effective querying:
- Filter by specific APIs using
api_namelabel - Analyze metrics by namespace or pod
- Make performance comparisons between different environments
Conclusion
Integrating Apinizer with Prometheus and Grafana provides powerful monitoring capabilities for your API management infrastructure. By properly configuring metric collection, creating informative dashboards, and implementing alarms, you can ensure optimal performance, quickly detect issues, and make data-driven decisions about your API ecosystem.
This integration benefits from the strengths of each component:
- Apinizer's comprehensive metric collection feature
- Prometheus's efficient time series database and powerful query language
- Grafana's flexible and beautiful visualizations
Start monitoring your Apinizer deployment today to gain deeper insights about API gateway and cache performance.
Resources
For more information:
- Apinizer Documentation
- Prometheus Documentation
- Grafana Documentation