Architecture
This page comprehensively describes the technical architecture of the Apinizer platform. It contains detailed information about the platform's Kubernetes-native architectural approach, core components (API Manager, API Gateway), environment structure, deployment flexibility, scalability, high availability (HA), and external system integrations.
Detailed information about API Manager, API Gateway, Environment structure, and core architectural components.
Kubernetes-native architecture, platform independence, and cloud integrations.
Horizontal scaling, Gateway independence, and HA architecture.
Authentication, log management, messaging, and API Integrator connectors.
Configuration database, analytics storage, and log management.
1. Core Architectural Approach and Components
The Apinizer platform has a Kubernetes-native, modular, and distributed architecture designed to meet modern API Management requirements. The platform provides high performance, scalability, and flexibility through the separation of Control Plane (API Manager) and Data Plane (API Gateway).
Architecture Type
Apinizer has a modular, distributed, and horizontally scalable architecture. This architecture enables:
- Independent Scaling: Components can be scaled independently. API Gateways can be scaled independently from API Manager.
- High Performance: Performance issues are not experienced in high-traffic environments. Low latency is achieved through Local Cache usage.
- Resource Optimization: Resource usage is optimized. Appropriate resource allocation can be made for each component.
- Continuous Operation: The system can operate continuously. Automatic failover mechanisms come into play when components fail.
Core Components (High-Level)
The Apinizer platform consists of the following core components:
API Manager (Management Console)
API Manager is the Control Plane (Management Plane) component of the Apinizer platform. It is responsible for all management operations of the platform and manages the configuration of API Gateways.
Architectural Role:
API Manager is the central management component of the platform. All configuration changes, API definitions, and system settings are made through this component. Changes made in API Manager are transmitted to API Gateway (Worker) components through Management API and loaded into their Local Caches.
Relationship with API Gateway:
API Manager and API Gateway represent the Control Plane and Data Plane separation in modern API Management architecture. While API Manager is responsible for configuration and management operations, Gateway is the high-performance component where real API traffic is processed. Thanks to this separation, Gateway can be scaled independently from API Manager and performance issues are not experienced in high-traffic environments.
For detailed features and usage of API Manager, see the API Manager page.
API Gateway
API Gateway is the Data Plane (Data Plane) component of the Apinizer platform. It is the high-performance and scalable component where real API traffic is processed.
Architectural Role:
API Gateway is the traffic processing layer of the platform. All API traffic passes through this component. Gateway components are called Workers and each Worker runs as an independent pod/container. Thanks to this architecture, the system can be scaled horizontally by increasing the number of Workers according to traffic increase.
Local Cache and Independent Operation:
Each Worker has its own Local Cache. When a Worker starts, it pulls configurations from MongoDB through Management API and loads them into Local Cache. This way, database access is not required for each API request and high performance is achieved. API Gateway can operate independently from API Manager; even if API Manager is not running, Workers continue to process API traffic with configurations in their Local Caches. For more information about cache architecture, see the Cache Component page.
Sub-components:
API Gateway contains sub-components such as Proxy Handler (Policy Enforcement Point), Token Provider API, Db-2-Api, Script2API, and MockAPI. These components are used to process different types of API requests and route them to backend services.
For detailed features, sub-components, and usage of API Gateway, see the API Gateway page.
Environment
In the Apinizer Platform, an Environment, is a virtual server space where API Gateways (Workers) run, has its own access address and settings, is isolated from other Environments, and operates using resources such as CPU and RAM allocated to it.
Kubernetes Namespace Equivalent:
Environment corresponds to the Namespace expression in the Kubernetes context. Kubernetes clusters can manage large amounts of disconnected workloads simultaneously. Kubernetes uses a concept called Namespace to eliminate the complexity of objects within the cluster. Namespaces allow objects to be grouped together and these groups to be filtered and controlled as a unit.
Environment Structure:
An Environment consists of multiple API Gateway (Worker) groups. Within each Environment:
-
Worker Pods: Pods where API Proxys run. Each Worker pod is an independent API Gateway instance and has its own Local Cache.
-
Cache Pods: Distributed cache (Hazelcast) pods. They hold shared cache data among Workers.
Namespace Independence:
Gateway pods and Cache pods can now run in different Kubernetes namespaces. Gateway pods can access cache servers in other namespaces using Kubernetes service discovery (e.g., http://cache-http-service.apinizer-cache.svc.cluster.local:8090). This provides more flexible infrastructure management and allows you to separate Gateway and Cache workloads. For Cache Server configuration, see the Distributed Cache page.
Environment Isolation:
Each Environment is completely isolated from other Environments:
-
Resource Isolation: Each Environment has allocated CPU and RAM resources. Resource usage in one Environment does not affect other Environments.
-
Network Isolation: Each Environment has its own access address and network settings. Different Environments can be accessed through different URLs.
-
Configuration Isolation: Each Environment has its own configuration settings. API Proxys can be deployed to one or more Environments and can run with different configurations in each Environment.
Multiple Environment Usage Scenarios:
1. Lifecycle Management:
API lifecycle is managed by creating Environments for different purposes such as Development, Test, and Production:
- Development Environment: Used for APIs in development phase
- Test Environment: Used for test and QA processes
- Staging Environment: Used for final checks before going to production
- Production Environment: Used for live system
2. Resource Isolation:
Grouping resource-intensive APIs to run them in isolation, thus preventing other APIs' performance from being adversely affected:
- High-traffic APIs can run in a separate Environment
- Dedicated Environments can be created for critical APIs
- Separate Environments can be used for different customers or departments
3. Geographic Distribution:
Geographic distribution can be achieved by creating different Environments in different locations:
- Each location can have its own Environment
- Location-based traffic routing can be done
- Local data storage requirements can be met
Note: API Proxys can be deployed to one or more Environments. All Environments where deployment is made are located within a Kubernetes cluster and run on servers where the Apinizer Platform is installed.
Architectural Plane
The Apinizer platform consists of two main planes: Data Plane (Gateway) and Control Plane (Management), in accordance with modern API Management architecture.
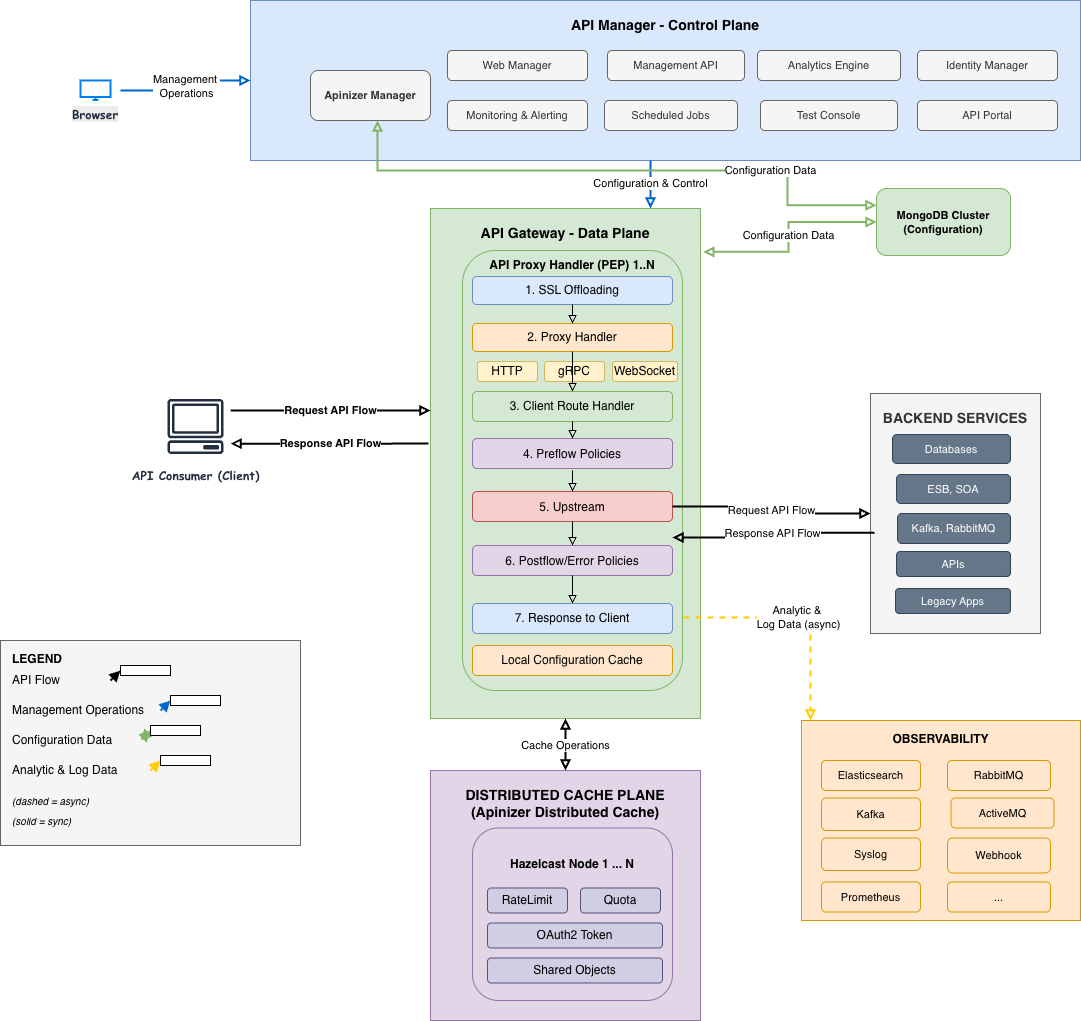
API Gateway Request Processing Flow:
The diagram above shows how API Gateway (Worker) processes an API request:
-
Route Matching: The incoming request is handled by the Route Matching component. The appropriate API Proxy is found based on Path, Host, Method, and Header information, and MessageContext is created.
-
Policy Enforcement (Request Pipeline): MessageContext passes through the Request Pipeline and 4 categories of policies are applied in order:
- Security Policies
- Traffic Management Policies
- Message Validation Policies
- Message Transformation Policies
For detailed information about message processing and policy application, see the Message Processing and Policy Application page.
-
Routing Decision: After policies are successfully applied, the appropriate handler is selected by RoutingHandlerFactory. For more information about Routing, see the relevant page.
-
Service Handler: The selected handler (Backend API, Db-2-Api, MockAPI, Script2API, etc.) processes the request.
-
Response Pipeline: The response from the backend passes through the Response Pipeline (transformation, encryption, logging, etc.).
-
Response: The processed response is returned to the client.
API Proxy Processing Flow:
Policies applied within Proxy Handler are grouped into four main categories: Security, Traffic Management, Message Validation, and Message Transformation. These policies are applied in order through Request Pipeline and Response Pipeline. For detailed information, see the Message Processing and Policy Application page.
Distributed Cache
Apinizer manages data shared by its components and provides performance improvement by storing it in distributed cache.
Apinizer uses Hazelcast technology as its distributed cache implementation, which can be easily scaled on Kubernetes, can be managed with dynamic configuration, and demonstrates successful performance. Objects such as Quota, Throttling, OAuth2 Token, Load Balancing Object, etc. are stored and processed on Distributed Cache. Cache Servers can run in independent namespaces from Gateway pods and are accessible via Kubernetes service discovery.
Cache API is used for all operations to be performed on the cache. Gateway pods connect to cache servers in different namespaces via Cache Management API.
For detailed information about distributed cache architecture and usage, see the Cache Component page. For Cache Server configuration, see the Distributed Cache page.
2. Deployment Flexibility and Operating Environments
Apinizer is a Kubernetes-native platform and is designed in accordance with modern cloud-native architectural principles. The platform is developed as Java-based and thus offers wide compatibility and flexibility.
Kubernetes-Native Architecture
Apinizer is a platform built on the Kubernetes ecosystem. All its components run as Kubernetes pods and fully utilize Kubernetes' native features (deployment, service, configmap, secret, etc.). This architectural approach enables:
- Standard Kubernetes APIs: Standard APIs and resources of Kubernetes are used
- Native Scaling: Automatic scaling with Kubernetes Horizontal Pod Autoscaler (HPA) and Vertical Pod Autoscaler (VPA)
- Service Discovery: Inter-component communication with Kubernetes Service Discovery mechanism
- ConfigMap and Secret Management: Configuration and sensitive data are managed with Kubernetes native resources
- Health Checks: Health checks with Kubernetes liveness and readiness probes
- Resource Management: CPU and memory resources are managed with Kubernetes limit and request mechanisms
Supported Kubernetes Platforms
Apinizer works seamlessly on all platforms that support the Kubernetes standard. These platforms include:
Enterprise Kubernetes Platforms:
- Kubernetes: Standard Kubernetes clusters (any distribution)
- Red Hat OpenShift: All versions of OpenShift 3.11 and above
- VMware Tanzu: Tanzu Kubernetes Grid and Tanzu Application Platform
- Rancher Kubernetes Engine (RKE2): Kubernetes clusters managed by Rancher
Public Cloud Kubernetes Services:
Apinizer can be easily deployed on major public cloud providers' managed Kubernetes services:
- Amazon EKS (Elastic Kubernetes Service): Full support on AWS cloud infrastructure
- Microsoft AKS (Azure Kubernetes Service): Full support on Azure cloud infrastructure
- Google GKE (Google Kubernetes Engine): Full support on Google Cloud Platform
Standard Kubernetes deployment methods are used to deploy Apinizer on these cloud services. Thanks to cloud providers' managed Kubernetes services, infrastructure management burden is reduced and platform installation and management become even easier.
Platform Independence
Thanks to Apinizer being Java-based and having a Kubernetes-native architecture, it works seamlessly in every environment where Kubernetes runs. This provides the following advantages:
- Operating System Independence: Works on all operating systems supported by Kubernetes (Linux, Windows Server, etc.)
- Infrastructure Independence: Can run on physical servers, virtual machines (VMware, Hyper-V, KVM), or cloud environments
- Cloud Provider Independence: Can run on any cloud provider or on-premise environment
- Kubernetes Distribution Independence: Works on different Kubernetes distributions such as standard Kubernetes, OpenShift, Tanzu
Rootless Container Support
Apinizer container images are provided as rootless (without root user). This feature enables:
- Security: Containers run without root user, security risks are reduced
- Compatibility: Can run on all container orchestration platforms
- Compliance: Better compliance with security standards and compliance requirements
- Flexibility: Can run even in restricted environments
Note: Since Apinizer images are provided as rootless from DockerHub, they can be run securely on any Kubernetes-based platform.
DMZ and LAN Separation
The Apinizer platform supports different components running in DMZ (Demilitarized Zone) and LAN (Local Area Network) zones in accordance with enterprise security architecture. This architectural approach enables protection of sensitive components and secure API access by working compatibly with firewalls and network segmentation.
Architectural Principles:
Since Apinizer's API Gateway components can operate independently from API Manager, they can be positioned in different network zones and even in different locations according to security and performance requirements. Thanks to this flexibility:
- Gateways can be positioned in DMZ, API Manager in LAN
- Gateways can be run in geographically distributed locations
- Gateways in each location have their own Local Caches
- API Manager is needed only for configuration changes
DMZ Zone - External Access Layer:
DMZ is the secure intermediate zone where traffic from the internet and external networks is received. The following Apinizer components run in this zone:
-
API Gateway (Worker) Modules: Proxy Handlers that handle API requests from clients and external organizations. These gateways:
- Process traffic from external clients
- Perform TLS/SSL termination
- Apply authentication and authorization policies
- Perform rate limiting and throttling operations
- Route to backend services
- Keep configurations in their Local Caches
-
API Portal: API discovery and documentation portal for external developers and partner organizations. The portal is positioned in DMZ to be opened to external access.
-
Load Balancer: Performs traffic distribution and load balancing operations. External traffic first comes to Load Balancer, then is distributed to Gateway pods.
Communication from DMZ to LAN:
Gateways in DMZ connect to some services in LAN for their operation:
- MongoDB Cluster: To get configuration data (at startup and configuration changes)
- Logging Services: To send API traffic logs (Elasticsearch, Kafka, etc.)
- Kubernetes Control Plane: For pod management and service discovery
These connections are made in a controlled manner through firewalls and only necessary ports are opened.
LAN Zone - Internal Management Layer:
LAN is the internal network zone and sensitive management components are positioned here:
-
API Manager Module: The central management component of the platform. This component:
- Provides web-based management console
- Manages API Proxy definitions and configurations
- Performs user and role management
- Performs monitoring and analytics operations
- Transmits configuration changes to Gateways
-
MongoDB Cluster: The central database where all configuration and metadata are stored. Gateways pull data from this database at startup and configuration changes.
-
Elasticsearch Cluster: The log management system where API traffic logs and analytics data are stored. API Manager's Analytics features use this data.
-
Kafka Cluster: Messaging platform used for high-volume log flow (optional).
-
Distributed Cache (Hazelcast): Cache system where shared data such as Quota, throttling, OAuth2 token are stored. Cache Servers can run in independent namespaces from Gateway pods and are accessible via Kubernetes service discovery.
-
Internal Gateways: Gateways used for internal API traffic (optional). These gateways manage inter-service communication within LAN.
Security and Network Segmentation:
This architectural approach provides the following security advantages:
- Network Isolation: Sensitive management components (API Manager, MongoDB) are isolated from external networks
- Controlled Access: Only necessary connections from DMZ to LAN are opened and controlled by firewalls
- Reduced Attack Surface: Only Gateways and Portal are open to external access
- Defense in Depth: Protection is provided with multi-layered security approach
Geographic Distribution and Location Independence:
Thanks to API Gateways being able to operate independently from API Manager, Gateways can be positioned in different locations and even in different geographic regions:
- Edge Locations: Gateways can be positioned in locations close to users (low latency)
- Regional Distribution: Gateways can be run in different countries or regions
- Hybrid Cloud: Gateways can run both on-premise and in cloud environments
- Multi-Cloud: Gateways can be positioned on different cloud providers
Gateways in each location:
- Have their own Local Caches and keep configurations here
- Connect to API Manager only for configuration updates
- Are not dependent on API Manager during routine API traffic processing
- Can get configuration from local MongoDB replica or central MongoDB
3. Scalability and High Availability (HA)
The Apinizer platform provides the scalability and high availability features required for high-traffic and critical business applications. It is designed to meet API Gateway's continuous operation and performance requirements.
Horizontal Scaling
The Apinizer platform supports horizontal scaling of all its components according to needs. This way, system capacity can be increased according to traffic increase and resource usage can be optimized.
API Gateway (Worker) Scaling:
API Gateway components can be easily scaled according to traffic increase:
-
Manual Scaling: Worker count can be manually increased according to traffic increase. New Worker pods are created by increasing Kubernetes deployment replica count.
-
Automatic Scaling (HPA): Automatic scaling can be done according to CPU and memory usage using Kubernetes Horizontal Pod Autoscaler (HPA). HPA creates new pods when determined threshold values are exceeded, and removes pods when usage decreases.
-
High Availability: High availability is achieved with multiple Workers in each environment. If a single Worker fails, other Workers continue to process traffic.
-
Location-based Scaling: Gateways in different locations can be scaled independently. Worker count can be adjusted according to each location's own traffic requirements.
API Manager Scaling:
API Manager component can also be scaled horizontally:
- Management Load Distribution: API Manager pods can be replicated in environments with high management traffic
- Load Balancing: Load balancing is done among API Manager pods
Cache Scaling:
Distributed cache system (Hazelcast) can be scaled dynamically:
- Dynamic Cluster Expansion: New nodes can be added to Hazelcast cluster, existing nodes can be removed
- Automatic Data Distribution: When a new node is added, data is automatically redistributed
- Replication: Data is replicated on multiple nodes, no data loss occurs if a single node fails
- Partition Management: Data is divided into partitions and stored on different nodes
- Namespace Independence: Cache Servers can run in independent namespaces from Gateway pods and can be scaled independently
Database Scaling:
Database components can also be scaled:
- MongoDB Replica Set: Read performance can be increased with MongoDB replica set. Read operations can be distributed to secondary nodes.
- MongoDB Sharding: Horizontal scaling can be done with sharding. Data is distributed to different shards.
- Elasticsearch Cluster Expansion: Capacity can be increased by adding new nodes to Elasticsearch cluster. Indexes are distributed to different nodes.
Gateway Independence
API Gateway components can operate and scale independently from API Manager. This architectural feature is critical in high-traffic environments.
Independent Operation:
-
Local Cache: Each Worker has its own Local Cache and keeps configurations here. This way, database access is not required for each API request.
-
Configuration Independence: Workers pull configurations from MongoDB at startup and load them into Local Cache. Configuration changes are automatically transmitted to Workers through Management API.
-
Routine Traffic Processing: Even if API Manager is not running, Workers continue to process API traffic with configurations in their Local Caches. API Manager is needed only for new configuration changes.
Independent Scaling:
-
API Manager Single Instance: API Manager module can run as a single instance. Management traffic is generally much lower than API traffic.
-
Worker Multiple Instances: Worker modules can be scaled independently according to traffic requirements. Hundreds of Workers can be run in high-traffic environments.
-
Location Independence: Gateways can be run in different locations, on different Kubernetes clusters. Each location has its own Workers and Local Caches.
-
Resource Optimization: High CPU and memory can be allocated for Workers, lower resources for API Manager.
High Availability (HA)
The Apinizer platform provides the ability to deliver continuous service by running on Kubernetes High Availability Cluster (HA Cluster). Service continues uninterrupted even when system components fail.
HA Architecture:
-
Kubernetes HA Cluster: Platform runs on Kubernetes clusters that provide high availability with at least 3 Master Nodes. Even if one of the Master Nodes fails, the cluster continues to operate.
-
Load Balancer VIP: All access is made through Load Balancer VIP. Load Balancer routes traffic to healthy pods.
-
Pod Anti-Affinity: Pods are distributed to different nodes. Pod anti-affinity rules prevent multiple pods from running on the same node.
-
Health Check and Readiness Probe: Pod health status is continuously checked with Kubernetes liveness and readiness probes. Unhealthy pods are automatically restarted or removed from traffic.
HA Features:
-
API Manager Redundancy: Backup strategies are applied for API Manager module. Multiple API Manager pods can be run and load balancing is done among them. Even if an API Manager pod fails, Gateways continue to work with configurations in their Local Caches.
-
Worker Redundancy: High availability is achieved with multiple Workers in each environment. Workers are distributed to different nodes and if a single Worker fails, other Workers continue to process traffic. Load Balancer routes traffic to healthy Workers.
-
Database Replication: Data security is provided with MongoDB replica set. Data is replicated on multiple nodes. Even if the primary node fails, one of the secondary nodes automatically becomes primary and there is no data loss.
-
Cache Replication: Cache data is stored on multiple nodes with Hazelcast's built-in replication features. If a single cache node fails, data can be accessed from other nodes.
-
Elasticsearch Replication: Elasticsearch indexes are replicated on multiple nodes. If a single node fails, data can be accessed from other nodes.
-
Automatic Failover: With automatic backup and failover mechanisms, automatic transition to backup components occurs when system components fail. This transition is transparent to users and there is no service interruption.
Kubernetes HA Cluster Features:
-
At Least 3 Master Nodes: High availability is provided for Kubernetes control plane with at least 3 master nodes. Even if one of the master nodes fails, the cluster continues to operate.
-
Load Balancer VIP Access: All access is made through Load Balancer VIP. Load Balancer routes traffic to healthy pods and automatically transitions to backup pods in case of failure.
-
Pod Anti-Affinity Rules: Pods are distributed to different nodes. This way, service continues even if a single node fails.
-
Health Check and Readiness Probes: Pod health status is continuously checked with Kubernetes liveness and readiness probes. Unhealthy pods are automatically restarted or removed from traffic.
-
Node Failure Tolerance: Even if one or several Worker nodes fail, pods on other nodes continue to serve. Kubernetes automatically recreates pods on failed nodes on other healthy nodes.
Geographic High Availability:
-
Multi-Region Deployment: Gateways can be positioned in different geographic regions. Even if there is a problem in one region, Gateways in other regions continue to serve.
-
Active-Active Configuration: Gateways in different locations can run in active-active mode. Traffic is distributed to all locations and if one location fails, other locations continue to serve.
-
DNS-Based Failover: With DNS-based failover mechanisms, if one location fails, traffic is automatically routed to other locations.
4. External System Connections
The Apinizer platform offers a wide range of integrations to work integrated with your existing IT infrastructure. The platform can integrate with authentication systems, log management systems, messaging platforms, databases, and various external services.
Authentication Integrations
Apinizer provides secure API access by working integrated with enterprise authentication systems:
-
LDAP/Active Directory: User authentication with enterprise LDAP and Active Directory systems. User information and group memberships are retrieved from LDAP/AD and used for API access control.
-
OAuth2 Providers: Integration with popular OAuth2 providers:
- Google OAuth2
- Microsoft Azure AD
- Okta
- Other OAuth2 compatible identity providers
-
OIDC (OpenID Connect): Identity layer built on OAuth2. OIDC provides a standard protocol for authentication and obtaining user information. User identity information can be obtained with ID tokens and user info endpoints. Integration can be done with OIDC compatible identity providers.
-
SAML (Security Assertion Markup Language): Enables users to access all systems with a single identity credential with Single Sign-On (SSO) support. SAML 2.0 protocol is supported.
-
JWT (JSON Web Token): Token-based authentication. JWT tokens are created, verified, and renewed. Custom claims and token signing algorithms are supported.
Log and Monitoring Integrations
API traffic logs and system metrics can be integrated with central log management and monitoring systems. Apinizer can integrate with the following log and monitoring systems through API Creator and API Integrator modules:
Central Log Management Systems:
-
Elasticsearch: Log sending to Elasticsearch cluster for central log management. Although required for API Manager's Analytics features, logs can also be sent to external Elasticsearch systems. Index management and lifecycle policies are supported.
-
Graylog: Integration with Graylog log management system. Log sending can be done with Graylog GELF (Graylog Extended Log Format) protocol. Used for centralized log aggregation and analysis.
-
Splunk: Log sending to Splunk log analysis and reporting system. Integration can be done through Splunk Universal Forwarder or HTTP Event Collector (HEC). Log records are sent to Splunk indexes.
-
Logback: Log sending to Logback logging framework. Logs can be sent to different targets (file, database, network, etc.) using Logback appenders.
-
Syslog: Sending to log servers with Syslog protocol. RFC 3164 and RFC 5424 standards are supported. Logs can be sent to syslog servers with UDP and TCP protocols.
Messaging and Streaming Platforms:
-
Apache Kafka: Log sending to Kafka topics for high-volume log flow. Logs are sent to Kafka asynchronously using Kafka producer API. Partition strategies and compression support are provided.
-
RabbitMQ: RabbitMQ integration for message queue management. Log messages can be routed with exchange and queue configurations.
-
ActiveMQ: Log sending to Apache ActiveMQ messaging platform. Log messages can be sent with JMS (Java Message Service) protocol.
Monitoring and Metric Systems:
-
Prometheus: Metrics are exported in Prometheus format for metric collection and monitoring. Prometheus scrape endpoints are provided and custom metrics can be defined. Counter, Gauge, Histogram, and Summary metric types are supported.
-
Grafana: Grafana integration for visualization and dashboards. Dashboards can be created by pulling data from Prometheus or Elasticsearch data sources. Custom panels and alerting rules can be defined.
Event-Driven Integrations:
- Webhook: POST requests are sent to HTTP/HTTPS webhook endpoints for event-based notifications. Custom headers and payload formats are supported. Retry mechanisms and timeout settings can be configured. Log events and system events can be notified to external systems through webhooks.
Messaging Integrations
Integration with messaging platforms for high-volume log flow and event-based notifications:
-
Apache Kafka: Log sending to Kafka topics for high-volume log flow. Logs are sent to Kafka asynchronously using Kafka producer API. Partition strategies and compression support are provided.
-
RabbitMQ: RabbitMQ integration for message queue management. Message routing can be done with exchange and queue configurations.
-
Apache ActiveMQ: Integration with Apache ActiveMQ messaging platform. Message sending and receiving can be done with JMS (Java Message Service) protocol. Topic and Queue destinations are supported.
-
Webhook: POST requests are sent to HTTP/HTTPS webhook endpoints for event-based notifications. Custom headers and payload formats are supported. Retry mechanisms and timeout settings can be configured.
API Integrator Connectors
The API Integrator module offers a wide range of connectors to integrate with various external systems. Thanks to these connectors, APIs can be created, databases can be accessed, and various actions can be performed.
Database Connectors:
API Creator and API Integrator modules can integrate with the following databases. For detailed information about database connections and connectors, see the relevant pages.
Relational Databases:
- Oracle Database: Oracle DB connections, SQL queries, and Stored Procedure execution
- MySQL: Connection and query operations to MySQL and MariaDB databases
- PostgreSQL: PostgreSQL database integration and advanced features
- SQL Server: Microsoft SQL Server connections and T-SQL queries
- IBM Db2: IBM Db2 database integration
- SAP Sybase: SAP Sybase database connections
NoSQL and Big Data Databases:
- MongoDB: MongoDB document database integration, collection queries, and aggregation operations
- Apache Hive: Big data queries with Hadoop Hive integration
- Apache Impala: Impala integration for high-performance SQL queries
- Trino (PrestoSQL): Distributed SQL query engine integration, multi-data source queries
Action Connectors:
API Integrator provides the following connectors to perform various actions:
-
API Call: Making calls to REST and SOAP APIs. HTTP/HTTPS requests, authentication (Basic, OAuth2, API Key), request/response transformation, and error handling support.
-
Database: Performing database operations. Executing SQL queries, calling Stored Procedures, transaction management, and connection pooling.
-
Email (SMTP): Sending email. Email sending by connecting to SMTP servers, HTML and plain text format support, attachment adding.
-
Notification: Sending notifications. Sending notifications to incident management systems like PagerDuty, Opsgenie, integration with custom notification services.
-
Linux Script: Running scripts on Linux servers. Remote script execution via SSH, shell script and command execution.
-
Script: Running JavaScript or Groovy scripts. Custom business logic implementation, data transformation, and calculations.
-
SNMP: Simple Network Management Protocol operations. Sending SNMP traps, SNMP GET/SET operations, network device monitoring.
Integration Scenarios:
Thanks to these connectors, integration scenarios such as the following can be realized:
- Database APIs: Converting your existing databases to RESTful APIs
- Data Synchronization: Data synchronization between different systems
- Event-Driven Operations: Event-based triggers and actions
- Notification Systems: Automatic notifications in alarm and event situations
- Data Transformation: Data transformation and mapping between different formats
- Orchestration: Coordinated operation of multiple systems
5. Data and Log Layer
In the Apinizer Platform, the data and log layer meets the system's data storage and logging needs. This layer is responsible for storing and managing configuration data, API traffic logs, analytics data, and other system data. The platform provides performance, security, and scalability by using separate databases for configuration data and log data.
Configuration Database (Metadata)
It is the central component where all configuration and metadata of the Apinizer platform are stored. All types of configuration, settings, and definitions made on the platform are stored in this database. Apinizer supports popular databases such as MongoDB and PostgreSQL. For detailed information about database connections, see the Connections page.
Architectural Role:
The database serves as Apinizer's "memory". All changes made through API Manager are stored here, and API Gateway components (Workers) pull configurations from here and load them into their Local Caches. Thanks to this architecture, configurations are managed centrally and all Workers work with the same configurations.
MongoDB Usage:
MongoDB is used to store all configuration data and metadata of the Apinizer platform. Everything defined and configured on the platform is stored in this database:
- API Proxy definitions and configurations
- Policy configurations (rate limiting, authentication, transformation, etc.)
- Environment settings and configurations
- Connection information and settings
- API Integrator configurations
- Cache configurations
- User and role definitions
- Scheduled Job definitions
- Alarm and action configurations
- Monitoring and Anomaly Detection settings
- API Proxy versions and deployment history
- User sessions and activity records
- Token records (OAuth2, JWT)
- Audit log records
- System events and history
- All other platform settings and configurations
Database Requirements:
- Replica Set Configuration: MongoDB must work with Replica Set configuration (even if it's a single node, it must be configured as Replica Set)
- Standalone Instance: Standalone Instance should not be used
- High Availability: At least 3 nodes are recommended for high availability
- Data Security: Data replication and automatic failover are provided thanks to Replica Set
Analytics Storage and Log Management
Apinizer offers a flexible log management architecture for storing and managing API traffic records. Elasticsearch is required if you want to monitor and report API Traffic through API Manager. In addition, API Traffic records can be sent asynchronously to multiple different targets through connectors.
Elasticsearch - API Manager Integration:
Elasticsearch is used to monitor, analyze, and report API Traffic through API Manager. Elasticsearch is required for API Manager's Analytics and Monitoring features to work. For detailed information about Analytics Engine, see the Analytics Engine page.
Data Stored in Elasticsearch:
- Request/response logs
- Performance metrics
- Error records
- Client information
- Endpoint usage statistics
- Usage metrics
- Performance analysis
- Error distributions
- Trend analyses
- Dashboard and reporting data
Elasticsearch Requirements:
- Index Lifecycle Management (ILM): ILM policies are used for lifecycle management of log data
- Backup and Snapshot: Data security is provided by taking regular snapshots
- Capacity Planning: Capacity planning is done according to log data growth and scaling is performed
Asynchronous Log Sending with Connectors:
In addition to Elasticsearch, API Traffic records can be sent asynchronously to multiple different targets through connectors. This way, you can transfer your log data to your central log management systems, messaging platforms, or databases.
Supported Connectors:
- ActiveMQ: Log sending to Apache ActiveMQ messaging platform
- Database: Writing log records to databases (Oracle, PostgreSQL, MySQL, etc.)
- Elasticsearch: Log sending to Elasticsearch cluster (required for API Manager integration)
- Graylog: Log sending to Graylog log management system
- Kafka: High-volume log flow to Apache Kafka messaging platform
- Logback: Log sending to Logback logging framework
- RabbitMQ: Log sending to RabbitMQ message queue system
- Syslog: Sending to log servers with Syslog protocol
- Webhook: Log sending to HTTP/HTTPS webhook endpoints
Thanks to these connectors, you can integrate your API Traffic records with your existing log management infrastructure, transfer them to your central log collection systems, or send them to your messaging platforms for real-time analysis.
Why Separate Databases?
Apinizer uses separate databases for configuration data and log data. This architectural approach provides the following advantages:
Performance Optimization:
- Separate Scaling: Configuration and log data have different performance requirements. Each database can be scaled according to its own requirements.
- Special Optimizations: Each database can be optimized according to its own usage scenario. MongoDB is optimized for configuration data, while Elasticsearch is optimized for log and analytics data.
- Resource Isolation: High-traffic log write operations do not affect configuration read/write operations. This way, API Manager's performance is protected.
Security and Access Control:
- Separate Access Policies: Access to log data can be kept more restricted. While only API Manager accesses the configuration database, different systems can access the log database.
- Data Masking: Special operations can be performed to mask sensitive data in logs. Sensitive information in the configuration database is stored encrypted.
- Compliance: Different compliance requirements can be met for different data types. Retention policies can be applied for log data, backup strategies for configuration data.
Scalability:
- Horizontal Scaling: Each database can be scaled independently. Log data growth does not affect the configuration database.
- Capacity Management: Log data growth does not affect the configuration database. Separate capacity planning can be done for each database.
- Cost Optimization: Appropriate resource allocation can be made for each database. Less resources can be allocated for the configuration database, more resources for the log database.