Reports and Analytics
Overview
AI Gateway → Analytics provides visibility into LLM usage, costs, and performance across your organization in a single page made up of seven tabs: Overview, Performance, Cost and Consumers, Usage Reports, Security and Guardrails, Provider Health, and Traffic. The project selector (admin mode), environment filter, date-range filter, and Export/Refresh actions are shared across every tab except Traffic, which carries its own environment/date filters.
The shared date-range filter offers Last 1, 3, 5, 7, 14, 30, or 90 days, and defaults to Last 1 day. The short windows (1/3/5 days) make it easier to notice, on a freshly opened page, that today's numbers are not there yet — see Data Freshness below.
Reports are scoped by role:
- System Admins — see cross-project, cross-organization data
- Project Managers — see data within their projects
- Team Leads — see data for their teams
- Regular Users — see their own usage
Deep-link directly to a tab with the ?tab= query parameter (e.g. .../ai-dashboard?tab=usage). Overview is the default tab so it doesn't appear in the URL; switching to any other tab updates the address bar automatically. Old links to the former standalone screens (Usage Reports, Guardrail Hits, Cache Efficiency) redirect here with the matching tab pre-selected.
When an A2A proxy publishes an agent directly (agent publishing mode), the incoming request is answered by a language model call made on Apinizer. The token usage and cost of that call are included in the reports and alerts on this page, and in token quotas.
Counting applies only to the agent publishing mode; proxies that forward the request to an external agent do not call a model themselves and are therefore not counted. MCP proxies also do not call a model during routing, so they are out of scope.
Counting starts from this version — past A2A traffic is not added retroactively to reports or quota consumption.
Data Freshness
The Overview, Performance, Cost and Consumers, and Usage Reports tabs read from a nightly consolidation job, not from live traffic. Today's data is not included until that job runs, so a report opened before the job has run for the current day will look like nothing happened today — this is expected, not a data-loss symptom. A panel marked Live is the exception: it reads real-time traffic directly instead of the consolidated rollup (for example, the Hourly Token Usage view below). The Security and Guardrails, Provider Health, and Traffic tabs are unaffected by this — they already read live data end to end.
Overview Tab
The default tab shown when the page loads. It summarizes the selected project/environment/date range: a daily token usage chart, provider/model distribution, summary rates (cache hit rate, guardrail hit rate, PII detection rate), a provider health summary (linking to the Provider Health tab), recent alerts, and an average guardrail/inference/overhead time summary (see the Performance tab for the full breakdown).
Alongside the breakdown tables, the Overview tab also charts token usage as input, output, and cached token series, so you can see at a glance how much of your traffic is being served from the semantic cache instead of billed as fresh output.
Two views are available:
- Daily Token Usage — one bar per day, for the selected date range (the shared Since filter at the top of the page).
- Hourly Token Usage — a sub-daily view with its own independent filter: Last 6, 12, 24, or 48 hours. Marked Live: it reads real-time traffic directly instead of the nightly rollup, so it includes today. Use it to spot a spike or a cache-hit-rate change within the current day, without waiting for the next daily consolidation.
The hourly view has its own loading state and filter, separate from the daily chart's date range — changing one does not refetch the other.
KPI Cards
At the top of the tab, summary indicators for the selected period:
- Total Tokens — total input + output + cached tokens for the period
- Active Users — number of users who sent at least one request during the period
- Average per Person/Month — average monthly token consumption per user
- Top Consumer — the person or application with the highest token/cost consumption for the period
Per-person reporting is available to system administrators.
Performance Tab
Alongside TTFT (Time To First Token) and TPOT (Time Per Output Token) summary cards, this tab shows request count, error rate, a daily requests/tokens chart, cache hit rate, and a per-model performance table (share, tokens, cost). In addition to those summary numbers, it includes a latency breakdown panel showing where request time goes:
Time spent in PII masking, content filters, and prompt inspection policies.
Measured in milliseconds (ms). Zero if no guardrail policies are active.
Time to receive the response from the LLM provider.
For streaming: first-token-time (TTFT). For non-streaming: full inference duration.
System overhead: serialization, network routing, caching lookup, etc.
Calculated as: total time - guardrail time - inference time.
Latency Example
Total request time: 1200 ms

Breakdown:
  ├─ Guardrail Time: 50 ms (PII mask + content filter)
  ├─ Inference Time: 1000 ms (LLM response)
  └─ Overhead Time: 150 ms (routing, serialization, etc.)
Cost and Consumers Tab
Shows budget status (limit, percent consumed, days left, over-budget projection), a cost burndown chart (actual vs. budget), cost by model, and a top-consumers table (top people/applications by cost and error rate). The former standalone Cache Efficiency screen now lives at the bottom of this tab:
How often the semantic cache served a response instead of calling the model — the cache hit rate — along with the estimated cost savings from those hits. A low hit rate on a proxy with repetitive traffic is a sign the similarity threshold may need adjusting.
Usage Reports Tab
This tab is the former standalone Usage Reports screen, reached via AI Gateway → Analytics. It offers multi-dimensional usage and cost breakdowns, drilldown, and XLSX export.
Usage Dimensions
Reports can be broken down by:
| Dimension | Scope | Description |
|---|---|---|
| Person | Individual | Usage per user ID / credential |
| Group | Team / Department | Usage per organization group |
| Organization Unit (OU) | Hierarchy | Usage per org tree node |
| Application | API Proxy | Usage per gateway rule |
| Model | LLM Model | Usage per model (GPT-4o, Claude-3, etc.) |
| Hierarchy | Organization tree | Parent organization total with sub-organization and consumer breakdown, over a chosen date range |
| Project | Project | Usage per API management project (admins only) |
| Team | Credential Organization | Usage per credential organization axis |
| Deployment Type | Infrastructure | Cloud vs. On-Premise (admins only) |
Select a breakdown from the tabs below (see Breakdown Tabs) to view the corresponding table and metrics.
Key Metrics
For each dimension, reports show:
- Token Count — total input + output tokens consumed
- Request Count — number of API calls
- Average Cost per Request — total cost ÷ request count
- Total Cost — cumulative cost (in display currency: USD or TRY)
- Cost YTD — cost from start of month to today
Breakdown Tabs
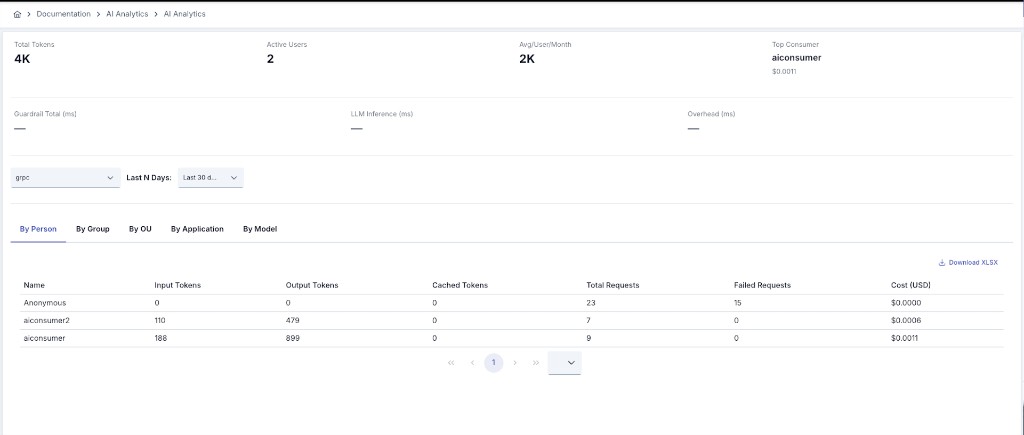
By Person
View individual user usage. Click a row to drill down into that person's model breakdown.
Accessible by: Users (own data), managers (team data), admins (all data)
By Group
Group usage aggregated by organization group. Useful for department-level cost allocation.
Accessible by: Admins, group managers
By OU
Organizational unit (org tree node) usage. Reflects your company structure.
Accessible by: Admins, OU leads
By Application
Usage per API Proxy (gateway rule). Identify which integrations are using the most LLM tokens.
Accessible by: Users (own apps), project leads (project apps), admins (all)
By Model
Cost and usage breakdown by LLM model. Helps identify which models are most expensive or frequently used.
- GPT-4o — 5000 requests, $250
- Claude-3-Sonnet — 2000 requests, $80
- GPT-4-Turbo — 500 requests, $150
Accessible by: Everyone
By Hierarchy
Answers the question the other tabs cannot: what did this organization spend in total, including everything beneath it?
The tab shows your consumer organizations as a tree. Every row carries the total of its whole subtree — its own consumers plus every sub-organization below it — so a parent's figure always equals the sum of the levels under it. Expand a row to see its sub-organizations and, underneath them, its consumers one by one with tokens, cost and the budget that governs them.
Date range. This is the only tab with a start/end date picker rather than the shared Last N days selector, because the report is normally pulled for a billing period ("last month", "the third quarter"). The range is inclusive on both ends and may span at most 366 days; a wider selection is refused rather than quietly trimmed.
Consumer list. Consumers load when you expand their organization, not up front, so an installation with thousands of consumers still opens instantly. Fifty are shown at a time with a Show more consumers row underneath, and the filter box narrows the list by consumer name. A consumer who spent nothing in the selected range is still listed, with zeros — the tab answers "who is in this group and what did they spend", so a silent member must not disappear from the headcount.
Budget column. Each row shows the monthly token budget that governs it and where that budget comes from: the row's own budget, or the nearest organization above it (shown as Inherited from). This is the nearest explicit budget, not the full runtime ceiling — for the exact effective limit of a single consumer, open its Limits tab.
Usage share. Shown only when the selected range stays inside one calendar month, because budgets are monthly: comparing a monthly budget against a 90-day window would show 300% for a consumer who never exceeded anything. Outside a single month, and for rows with no budget anywhere in the chain, the cell shows a dash.
Two rows can appear alongside your organizations:
- No organization — consumers that belong to no organization, plus usage whose consumer record no longer exists (a deleted consumer, for example). Their spend is real, so it is shown rather than dropped.
- Anonymous traffic — AI traffic with no consumer identity. It counts towards the totals but is not counted as a consumer.
Unclassifiable rows. When an organization's parent cannot be resolved, that row is shown at the top level of the tree with an Unclassifiable label next to it; hover the label to read the reason. There are three: the parent organization is not visible in this project (it belongs to another project, or it was deleted), the parent chain loops back on itself, or the chain is deeper than the product allows.
The figures on these rows are correct and counted exactly once; only their position in the tree is uncertain. The spend is not dropped, because an organization quietly disappearing from the report is far worse than one shown at the wrong indentation. When you see such a row, fix that organization's parent link on the Consumer Organizations screen; once the link is valid the row moves back into place and the label disappears.
A consumer's spend — including its past spend — is reported under the organization it belongs to today. If you move a consumer to another organization, its earlier usage moves with it, so this tab can disagree with the By Group tab for that consumer. This is deliberate: it is the only way a parent's total can always equal the sum of the levels below it.
The environment filter at the top of the page has no effect on this tab. Like the other consolidated tabs, it reads the daily usage rollup, which has no environment dimension.
This tab reads the same consolidated usage data as the other report tabs, which is refreshed on a schedule rather than live. The current day is therefore incomplete until the next consolidation runs — see Data Freshness.
Accessible by: Users with AI Analytics or Analytics view permission on the project. Export requires the separate export permission (see Export below).
By Project
Cross-project usage summary (system admins only). Useful for comparing project costs and resource allocation.
Accessible by: System admins only
By Team
Usage by credential organization (the team that owns the API credentials). Reflects organizational consumption patterns.
Accessible by: Team admins, system admins
By Deployment Type
Usage split between Cloud (managed providers) and On-Premise (self-hosted models). Useful for infrastructure planning.
- Cloud: OpenAI, Anthropic, Azure → 8000 requests, $400
- On-Premise: vLLM, Ollama → 2000 requests, $0 (self-hosted)
Accessible by: System admins only
Time Range
This tab uses the shared date range filter at the top of the page — see Overview for the available windows and the current default. Cost YTD always includes month-start to today, independent of the selected window.
Report Type Selection
Pick a report type from the dropdown: Usage, Cost, Performance, Guardrail Hits, Cache Efficiency, Provider Health, or Combined (all metrics in one view).
Export to Excel
Click Export (XLSX) to download the current report as an Excel file:
- Includes all visible rows from the selected breakdown
- Columns match the on-screen table (tokens, requests, cost, etc.)
- Formatted with headers and basic styling
- Cost values show in the selected currency (USD or TRY)
Note: Cross-project exports require system admin privileges.
Drilldown & Navigation
Click on a row in any table to drill down:
- By Person → Model Breakdown — which models did this person use?
- By Team → Person Breakdown — which people in this team used the most?
- By Model → By Person — who used GPT-4o the most?
Close the drilldown with the back button or breadcrumb.
Caching & Refresh
This tab reads the same nightly-consolidated data described in Data Freshness above. Aggregation runs:
- Nightly (UTC) for historical data
- On-demand when you open the report (if configured)
Click Refresh to force re-aggregation of the current period.
Multi-Currency Display
If configured in AI Cost Settings, costs display in your chosen currency:
- USD:
$0.05 - TRY:
0.04 ₺(if rate is set, e.g., 38.5)
All metrics remain in absolute token counts (not currency-dependent).
Permission Examples
| Role | By Person | By Project | By Deployment | Cross-Project Export |
|---|---|---|---|---|
| Regular User | Own only | Own only | ❌ | ❌ |
| Project Manager | Project only | Project | ❌ | ❌ |
| Team Lead | Team only | Team | ❌ | ❌ |
| System Admin | All | All | ✅ | ✅ |
Security and Guardrails Tab
How many requests were flagged or blocked by your guardrail policies (PII masking, prompt-injection guard, DLP, loop guard, off-topic guard, oversized guard), broken down by guardrail type and the action taken. Use it to spot a guard that's blocking too often — or too rarely. When Prompt Protection or Off-Topic Protection uses an external provider, rows also break down by provider (the built-in check or the external judge) and by verdict (blocked, timed out, errored, or skipped due to misconfiguration) — safe verdicts aren't included. Configure the guards this report reflects in Advanced Guardrails.
Content Safety Category Breakdown
The Guardrail Hits report also includes a Content Safety Categories (AILuminate) panel, breaking hits down by the same 14 built-in hazard categories described in Content Safety Categories (AILuminate). The category axis is intentionally bounded to those 14 codes (plus a catch-all bucket for anything else) rather than left open-ended, so the panel stays readable and a single mistagged rule can't blow it up. A category flagged as touching a GDPR Article 9 special category of personal data carries a visible badge here.
The panel respects the same project, environment, and — when you narrow the report to one AI Gateway — proxy filters as the rest of this tab. It populates as guardrail hits carry a matching content-safety category label; until then it shows no data for the selected period, the same empty state as any other widget on this screen, not an error.
Category labels follow the interface language: the Turkish UI shows the category catalog's Turkish label when one is defined, otherwise the canonical English name, otherwise the raw AILuminate code (the same fail-soft chain used by the sibling Content Safety Categories catalog screen). Label lookup is scoped to the active project — if another project has redefined the same category code with a different display name, that project's label never leaks into this report.
The same 14 categories (plus the catch-all bucket) are also tracked as a Prometheus counter, alongside the action (block/flag) and the evaluation engine (built-in, built-in + external, or external-only) that produced the hit — useful if you want to alert on content-safety trigger volume, or chart it outside this screen, without exporting from the report itself.
In addition to the usage/cost visibility on this page, see AI Asset Inventory (a separate, standalone screen) to check whether the AI assets in your installation comply with your allow-list and catalog definitions.
Provider Health Tab
Each LLM provider connection reports a live status — Healthy, Down, or Unknown — with its last measured response latency. This is the same latency data that feeds least-latency routing, so you can see why a request went to one connection over another.
AWS Bedrock and Google Vertex AI connections currently show as unhealthy here regardless of actual availability — the periodic check doesn't yet support their provider-native signing. This doesn't affect chat or embedding traffic through those connections; see LLM Providers and Connections for details.
Traffic Tab
Shows the AI-aware raw traffic log. It carries its own environment and date filters (the shared filter bar at the top of the page is hidden on this tab) and an auto-refresh selector for short-interval reloading. To follow a single request end-to-end, see Tracing and Replay.
Each row presents one request through the gateway in AI-first columns:
- Status · Time — the HTTP status badge with the request timestamp
- Request — the HTTP method, the AI Proxy name, and the proxy's relative path
- Model — the provider and the model that served the request; the upstream endpoint address is shown below, shortened to the host plus the last path segment (hover for the full address)
- Consumer — the consumer name and its IP address
- Tokens — input and output token counts, with the cached-token count below when the provider reused context
- Cost — the request cost calculated from AI Cost Settings
- TTFT · TPOT — time to first token and time per output token; a full semantic-cache hit shows
cacheinstead of a measurement - Latency — the total duration with a stage bar breaking it into guardrail, inference, and overhead time
- Flags — badges for detected PII, semantic-cache hits, requests blocked at the gateway, guardrail hits, and streamed responses
The address is deliberately recorded without its query string, so a value that could carry a credential — such as an API key passed as a query parameter — never ends up in a traffic record. This is also why Azure OpenAI's api-version query parameter, described in LLM Providers and Connections, never appears in the recorded address even though it was part of the actual request.
Record Detail Drawer
Choosing Detailed View from a row's menu opens a detail drawer on the right side of the screen. Its header shows the merged status (for example 200 Success), the method, and the route; the summary card below shows the API Proxy, project and environment, relative path, endpoint, creation time, and correlation id. The content is organized into tabs:
- Overview — request, client-connection and server-connection details, routing information, routing diagnostics (including a phase-timing bar for upstream selection and time to first byte), canary state, data-transfer sizes, and a performance waterfall of the request pipeline, backend routing, and response pipeline stages. When policy execution timing is enabled in Log Settings, per-policy durations appear here as well.
- Request from Client / Request to Target API / Response from Target API / Response to Client — the headers, parameters, and body of each hop of the request, with Base64 decode and XML/JSON formatting actions on the body.
- LLM Insights — all AI-specific data in one place: route, provider, model, token counts, cost, cache hit, TTFT and TPOT, the stage-latency breakdown, a PII alert when personal data was detected in the request, and a raw usage/meta table.
Row details open only while Enable API Traffic Log Details is turned on in the general settings.
Outbound MCP Tool / A2A Skill Calls
The LLM Insights tab of the detail drawer also shows which MCP tools or A2A skills/agents the proxy called outbound during that request — this is recorded whether tracing is on or off (previously it was only visible while tracing was active).
- The MCP Details section shows Outbound Tools Called (tool names deduplicated in first-seen order, comma-separated, truncated at 256 characters — never mid-name) and Outbound Tool Call Count (the raw total call count, including repeats)
- The A2A Details section shows the equivalent Outbound Skills/Agents Called and Outbound Agent Call Count — if an A2A target has no skill name, the agent key is shown instead
The count accumulates every call made across all turns of the same request in an agentic loop. Calls rejected by a guard or a quota are included too — the point of this audit trail is to show which tool a call attempted to reach.
Troubleshooting
No Data in Reports
- Confirm that requests have been sent through the AI Gateway
- Check that the date range includes the time of your requests
- Verify you have permission to view that breakdown (e.g., non-admins cannot view By Project)
Cost Shows $0
- Confirm per-model pricing is configured in AI Cost Settings
- Prices are stored in USD; if all models have price = 0, cost is $0
- New pricing changes apply to requests after the change; historical logs are not recalculated
Latency Breakdown Shows All Zeros
- Confirm guardrails or inference policies are active
- First few requests may not have latency data; try again after 5-10 more requests
- Check that the LLM provider is responding in reasonable time
Export File Is Empty
- Confirm you have permission to export (admins for cross-project)
- Verify the date range contains data
- Try clicking Refresh first to regenerate the aggregation
Next Steps
Set limits based on report insights
Configure pricing and currency display
Manage provider credentials
Follow an individual request end-to-end
Configure the guards behind the Guardrail Hits report
Configure the cache behind the Cache Efficiency report