API Traffic Tab
In the API Traffic tab, the message traffic of the API Proxy can be viewed and filtered, and log records of each message can be examined.
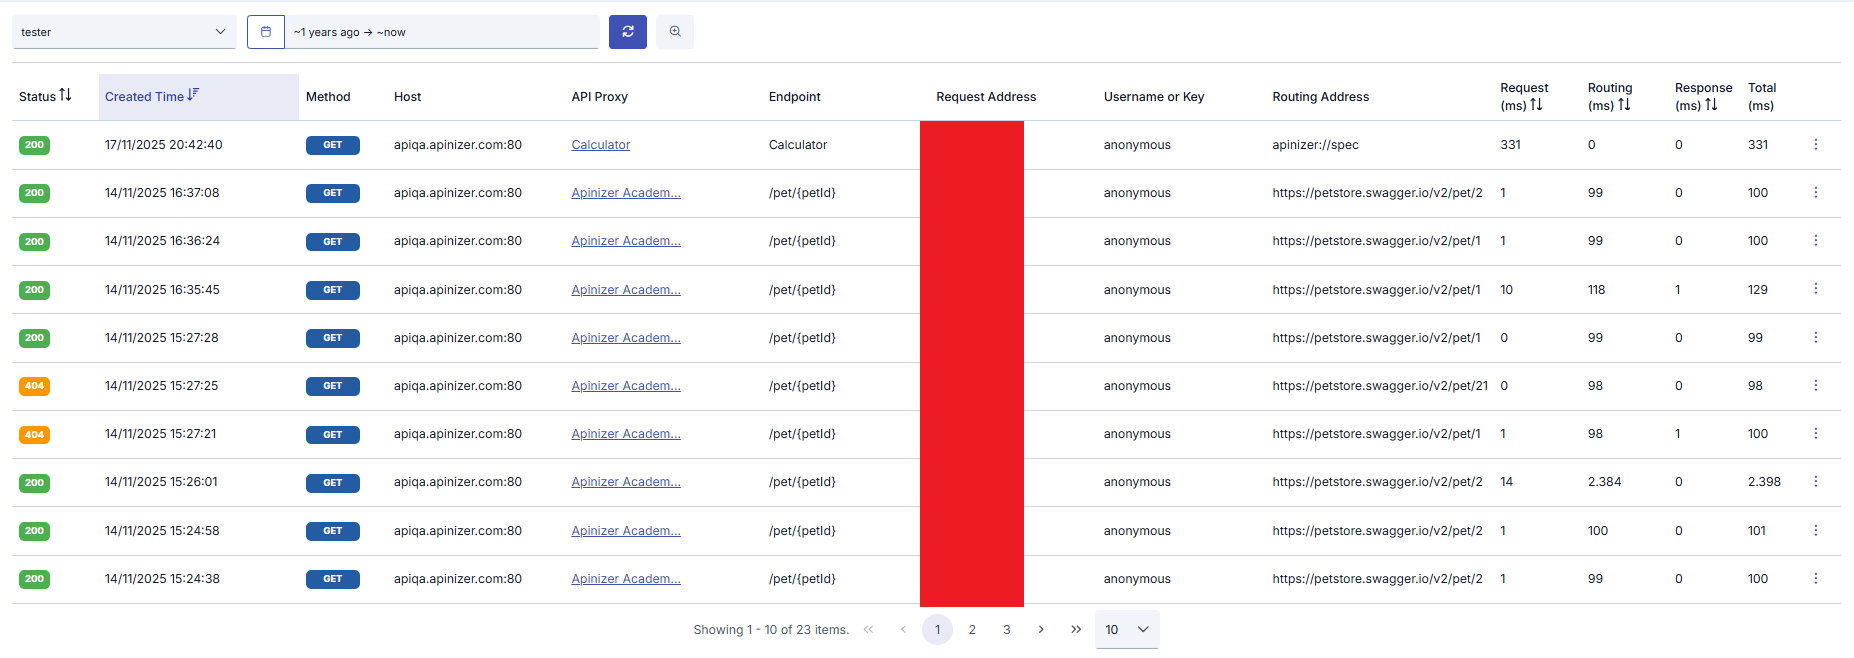
Each of the log records shown in the table belongs to a request coming from a client to this API Proxy and the response message given to that request. The following operations can be performed on this message.
Since WebSocket and gRPC requests are kept as data coming to and going from Apinizer, there are only 2 areas in these types of API Proxies.
Routing Address
This field holds the address information where the relevant API Proxy is routed. If this field is empty, it indicates that the request did not go to the backend address.
Services using Apinizer as backend are shown with the "apinizer://" prefix, it will write exactly "apinizer://<COMPONENT_NAME>/<METHOD_NAME>".
This also applies to proxies where routing is closed to prevent going to backend.
Possible values are;
| Routing Address | Condition |
|---|---|
apinizer://mirror.routing/<METOT_ADI> | API Proxy type Swagger 2.x, OpenAPI/Swagger 3.0.x, WSDL, Reverse Proxy or No-Spec API and Routing option is closed and Mirror option is open |
apinizer://specresponse.routing/<METOT_ADI> | API Proxy type Swagger 2.x, OpenAPI/Swagger 3.0.x, WSDL, Reverse Proxy or No-Spec API and Routing option is closed and Mirror option is closed |
apinizer://db2api.apicreator/<METOT_ADI> | API Proxy type DB2API |
apinizer://script2api.apicreator/<METOT_ADI> | API Proxy type Script2API |
apinizer://mockapi.apicreator/<METOT_ADI> | API Proxy type Mock API |
apinizer://connector/<METOT_ADI> | API Proxy type Connector |
apinizer://maintenance | API Proxy in maintenance mode |
apinizer://cache/<METOT_ADI> | In any API Proxy type and Caching is open |
http://<BACKEND_ADRESİ>/<METOT_ADI> or https://<BACKEND_ADRESİ>/<METOT_ADI> | API Proxy type Swagger 2.x, OpenAPI/Swagger 3.0.x, WSDL, Reverse Proxy, No-Spec API or KPS and Routing option is open |
apinizer://spec | API Proxy type Swagger 2.x, OpenAPI/Swagger 3.0.x, WSDL, Reverse Proxy, No-Spec API and access to spec address |
| (Empty) | Request cannot go to backend address for various reasons |
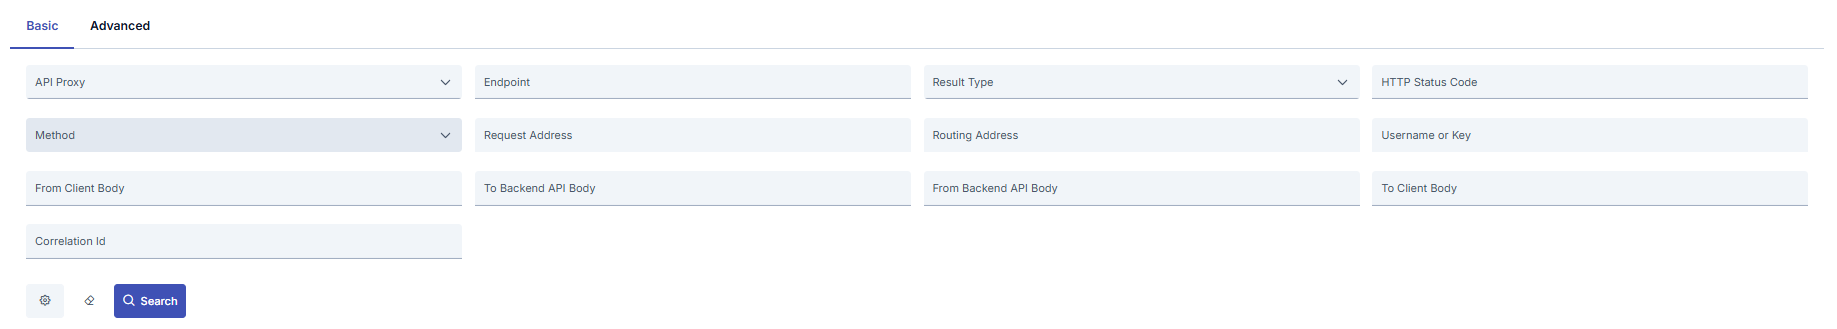
Filtering
Search can be performed in 2 different types (Basic, Advanced) with the More options option
In the Basic tab, filtering is applied to records with determined criteria such as a specific time range, endpoint, or HTTP method.
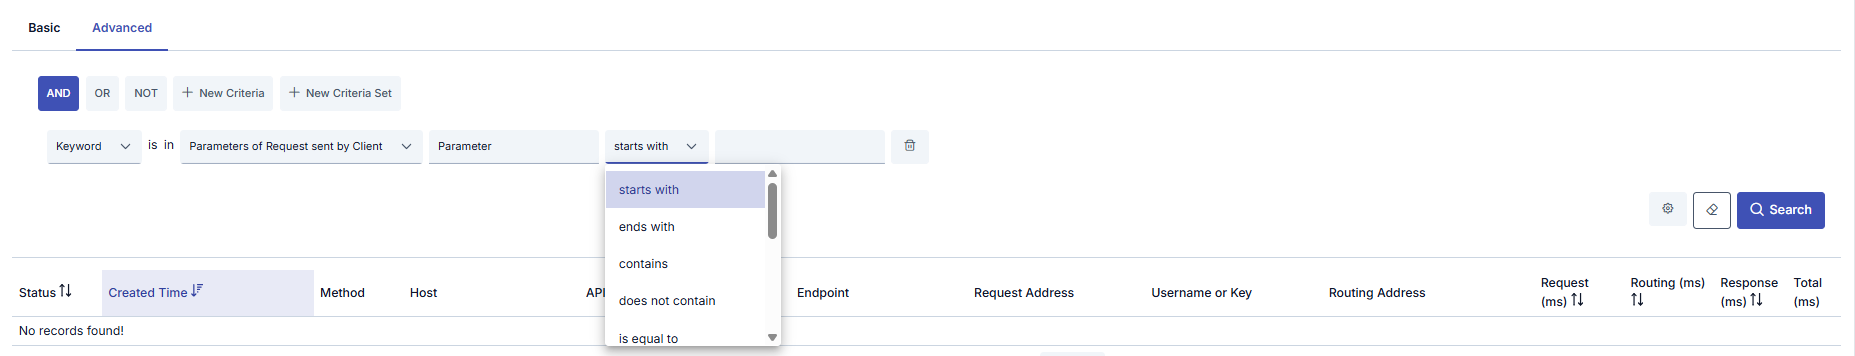
In the Advanced tab, users can create nested filters.
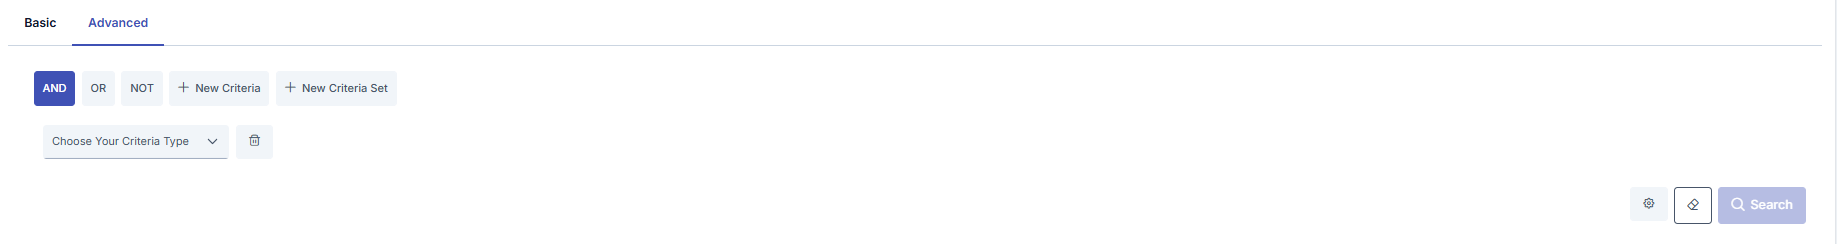
Search can be performed with the following options in the Advanced tab.
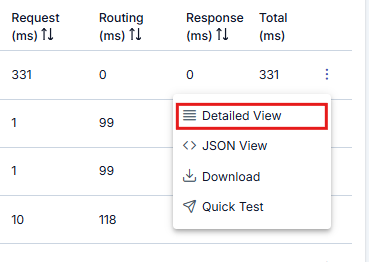
Detailed View
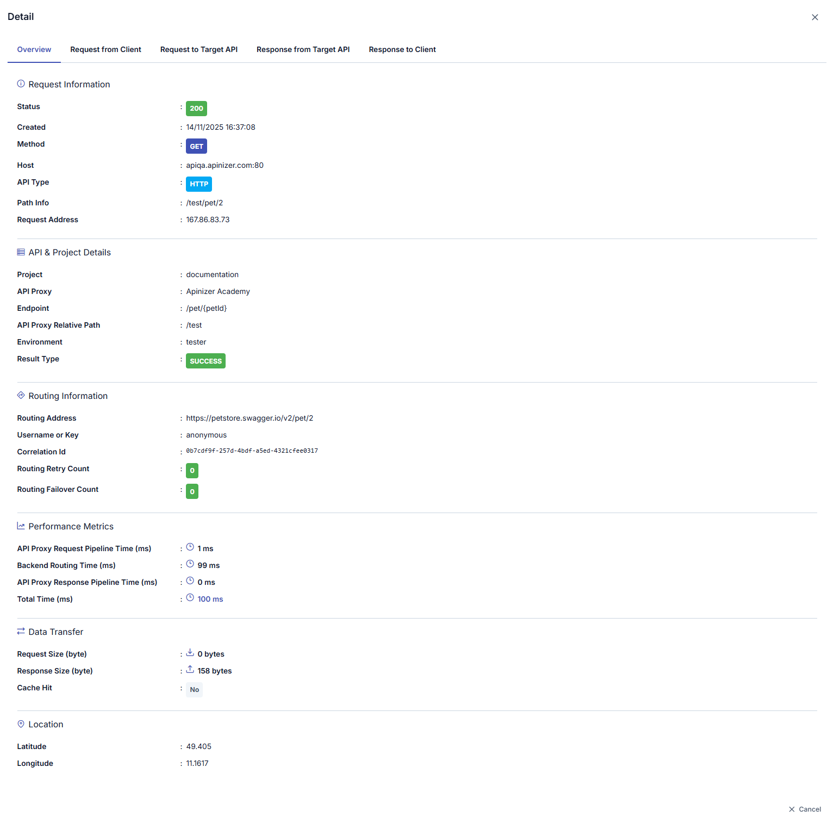
The first one in the menu at the end of the row of the request message to be examined opens a window displaying the log records of that message.
In the window that opens, it is seen that logs are divided into sections related to message flow. When the name of the section to be examined (for example, the Request From Client to API Proxy section) is clicked, log records related to this area are displayed. By default, the Overview section is open.
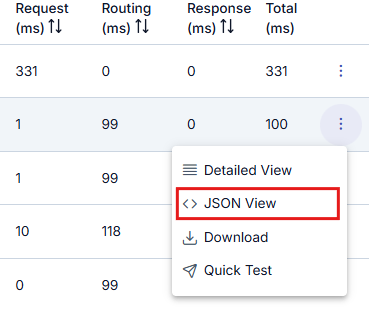
JSON View
The button below the Detailed View button displays log records in JSON format.
The visual containing the dialog opened when JSON View is clicked is shown below:
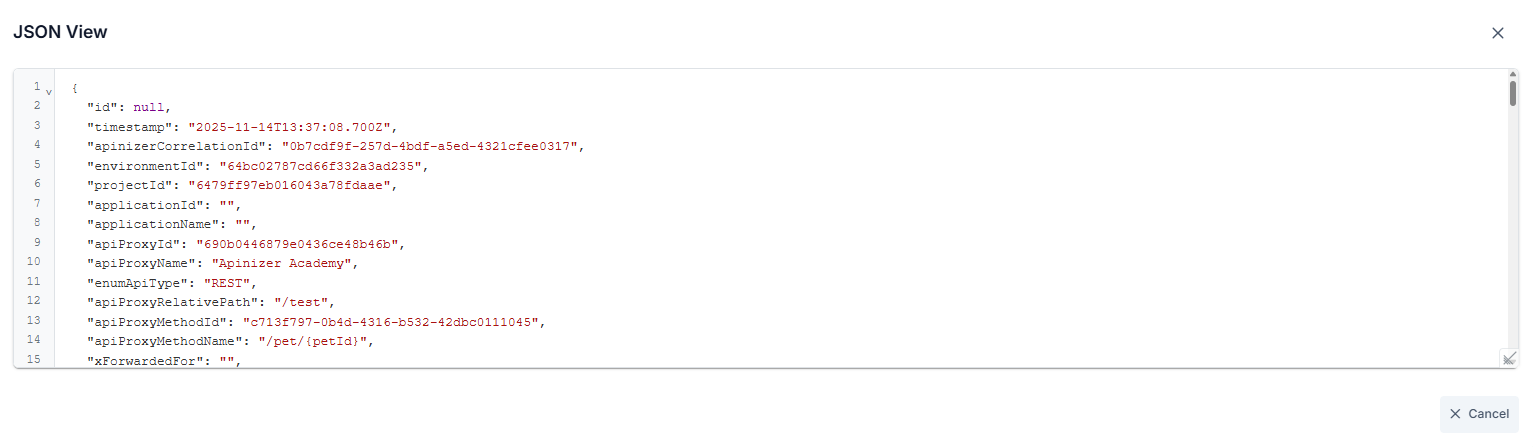
Key values in this field are written in a readable format, not as they are in the log file, to facilitate reading.
For example, the "apiProxyId" value is kept as "api" in the log record, when the log record is downloaded, the actual log record will be displayed.
For the actual log file format, you can examine the "Template Data Structure Table" on the Elasticsearch Manual ILM Policy and Template Creation page.
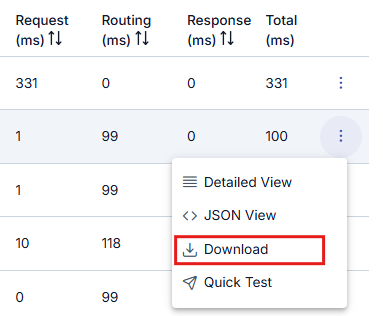
Download
It is also possible to download log records for more detailed examination.
Quick Test
The Quick Test button on the relevant row opens the Test Console formatted so that the sent request can be tested immediately by resending it.
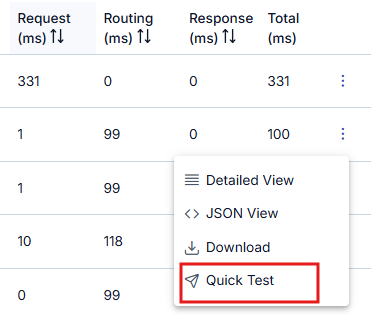
"Quick Test" button must be enabled in general settings to be visible.