Analytics Tab
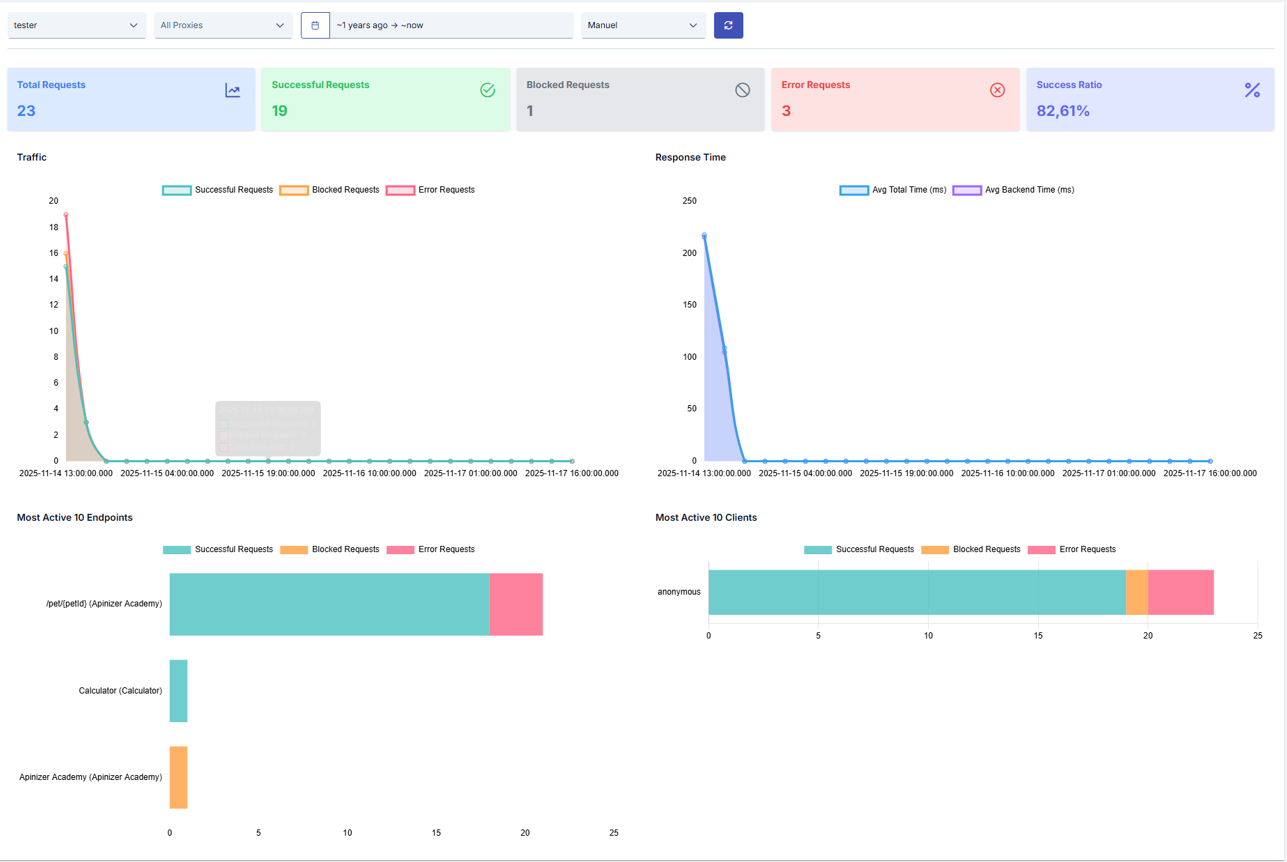
The API Analysis tab provides summary information about the API Proxy's performance, endpoint usage intensity, and client activity.
By selecting the refresh interval from the Choose your Refresh Time input, data is automatically refreshed until the page is changed.
The visual containing the Analytics tab is shown below:
Routing Diagnostics
The Analytics tab includes a Routing Diagnostics section that summarizes routing problems seen on requests this API Proxy sends to the backend. This section shows, in aggregate, the delays and failures that occur while connecting, reading, and leasing a connection from the connection pool.
This data is collected automatically whenever the Performance Metrics option is enabled in the connector's Log Settings (the default state); it is also collected even when that option is disabled, as long as Tracing is active for the request or the request ends in a failure/block. Data is only produced for requests that go to the backend; requests served from cache or that never reach the backend are not included here.
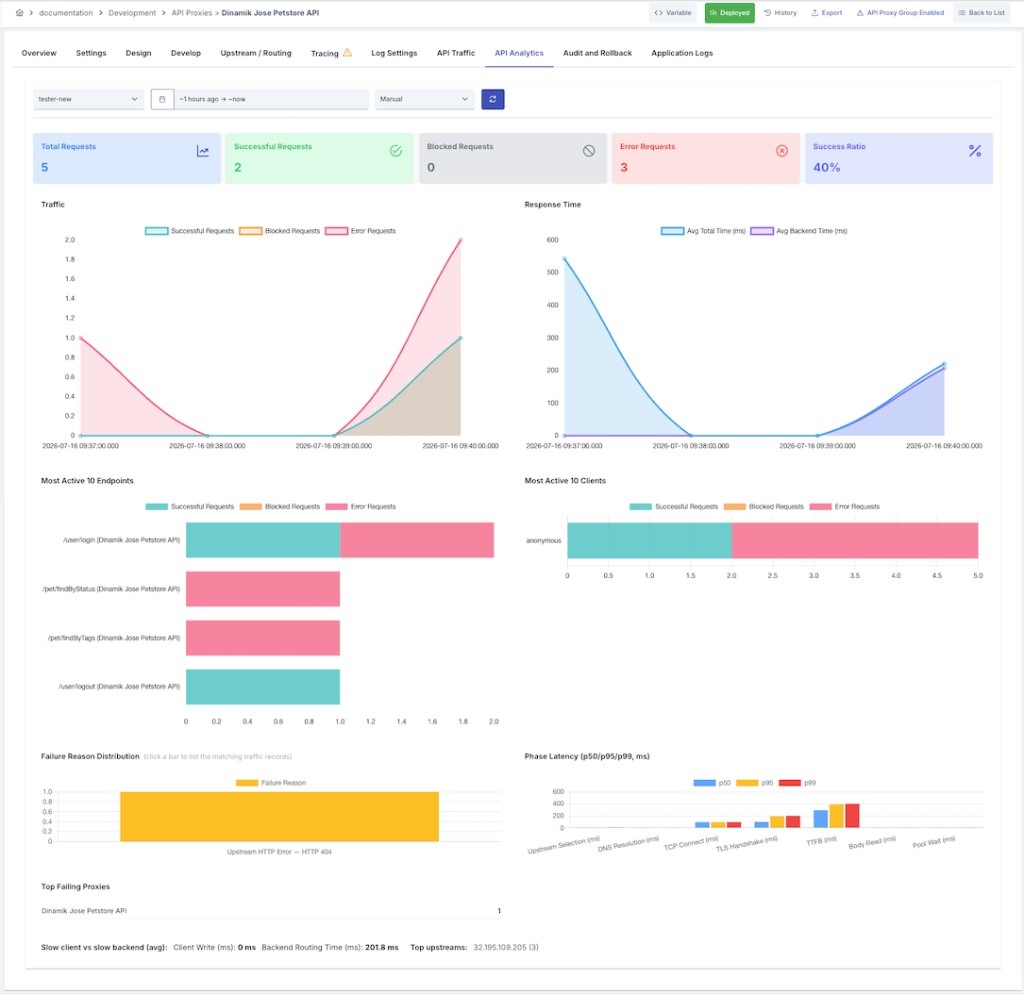
The first line of the section carries a permanent description of what the panel shows. Hovering the info icon next to each card title explains how to read that card; the same explanations are also collected in the "How to read?" panel. When there are no records in the selected range, the card points you to that panel's explanation of when the data stays empty.
Failure Reason Distribution
A bar chart showing the distribution of routing failures by reason over the selected time range. The chart's vertical axis is labelled in requests. Clicking a bar filters the records for that failure reason in the API Traffic table.
Possible failure reasons:
| Failure Reason | Description |
|---|---|
| Pool Timeout | Could not lease a connection from the pool within the configured time — the pool may be exhausted |
| Connect Timeout | TCP connection to the backend could not be established — backend down, wrong host/port, or network/firewall blocking |
| DNS Failure | Backend host name could not be resolved |
| TLS Handshake Failure | TLS handshake with the backend failed — certificate, protocol, or cipher mismatch |
| Read Timeout (no response) | No first byte was received before the read timeout on a reused connection — possibly a stale/broken connection |
| Read Timeout (slow backend) | First byte was received but the backend did not finish the response in time |
| Backend Closed | The backend closed the connection unexpectedly |
| Client Closed | The client aborted the connection before the response completed |
| No Healthy Upstream | No healthy backend address was available to route to |
| Circuit Open | The circuit breaker was open for this route; the request was not sent to the backend |
| Retries Exhausted | All retry/failover attempts failed |
| Upstream HTTP Error | The backend received the request and returned an HTTP error status |
| Unknown | The failure could not be classified from the available signals |
Phase Latency (p50/p95/p99)
A chart showing how much time requests to the backend spend in each phase. The chart's vertical axis is labelled in milliseconds (ms). p50/p95/p99 latency values are calculated for the following phases:
| Phase | Description |
|---|---|
| Selection | Choosing the target address via load balancing and circuit-breaker checks |
| DNS | Resolving the backend host name |
| TCP Connect | Establishing the TCP connection to the backend |
| TLS Handshake | TLS handshake for HTTPS connections |
| Time to First Byte (TTFB) | Time from sending the request to receiving the backend's first response byte |
| Body Read | Reading the entire response body |
| Pool Wait | Time spent waiting to lease a suitable connection from the connection pool |
This breakdown helps you tell whether slowness is happening during connection setup (DNS/TCP/TLS), on the backend's response (TTFB/body read), or in the connection pool (pool wait).
Other Summaries
- Top Failing Proxies: The API Proxies producing the most failures among requests with a routing failure record; the table is shown under the API Proxy and Failures columns
- Slow Client vs Slow Backend (average): An average comparison of the time spent writing the response to the client versus the backend processing time (both values are shown in ms) — indicates whether the slowness is on the client/network side or the backend side
- Top Upstreams: The upstream addresses (IP:Port) with the most failures; the number of requests is shown next to each address
For the Routing Diagnostics details of a single request (failure reason, confidence level, phase timing, recommended action, etc.), see the Detailed View panel on the API Traffic tab.