API Product View History
The API Product View History page reports in detail the visits and view statistics made to the documentation pages of API products published on the API Portal. This page allows you to analyze which APIs receive more interest, which products users look at more, and the source distribution of portal traffic.
What is API Product View History?
API Product View History is an analysis screen that reports how frequently API products published on the API Portal are viewed by users. This screen is used to measure access statistics of API documentation and user interest in products.
Purpose of This Page
Through this page, you can:
- Interest Level Analysis: Learn which API products are viewed more
- User Segmentation: Understand whether traffic comes from anonymous visitors or registered users
- Trend Analysis: Track view trends over time
- Documentation Optimization: Determine which products need more documentation
- Promotion Impact Analysis: Measure the impact of announcements or new features on traffic
Identify which API products are examined more frequently by developers
Analyze the source distribution of portal traffic (Anonymous vs. Registered)
Monitor view trends and changes over time
Make data-driven decisions for product portfolio and documentation strategies
Accessing the Page
To access the API Product View History page, follow these steps:
Log in to Apinizer Manager interface with administrator privileges
Click on Portal tab in the top menu bar
Click on the relevant portal from the portal list or go to Portal → Settings menu
Click on "API Product View History" or "API Ürün Görüntülenme Geçmişi" option from the left menu or settings page
- Alternatively, you can follow the path: Portal → API Products → View History
Data Analysis and Filtering
This report allows you to analyze the visibility and access details of API products. The filtering options and column descriptions below should be referenced to correctly interpret the data.
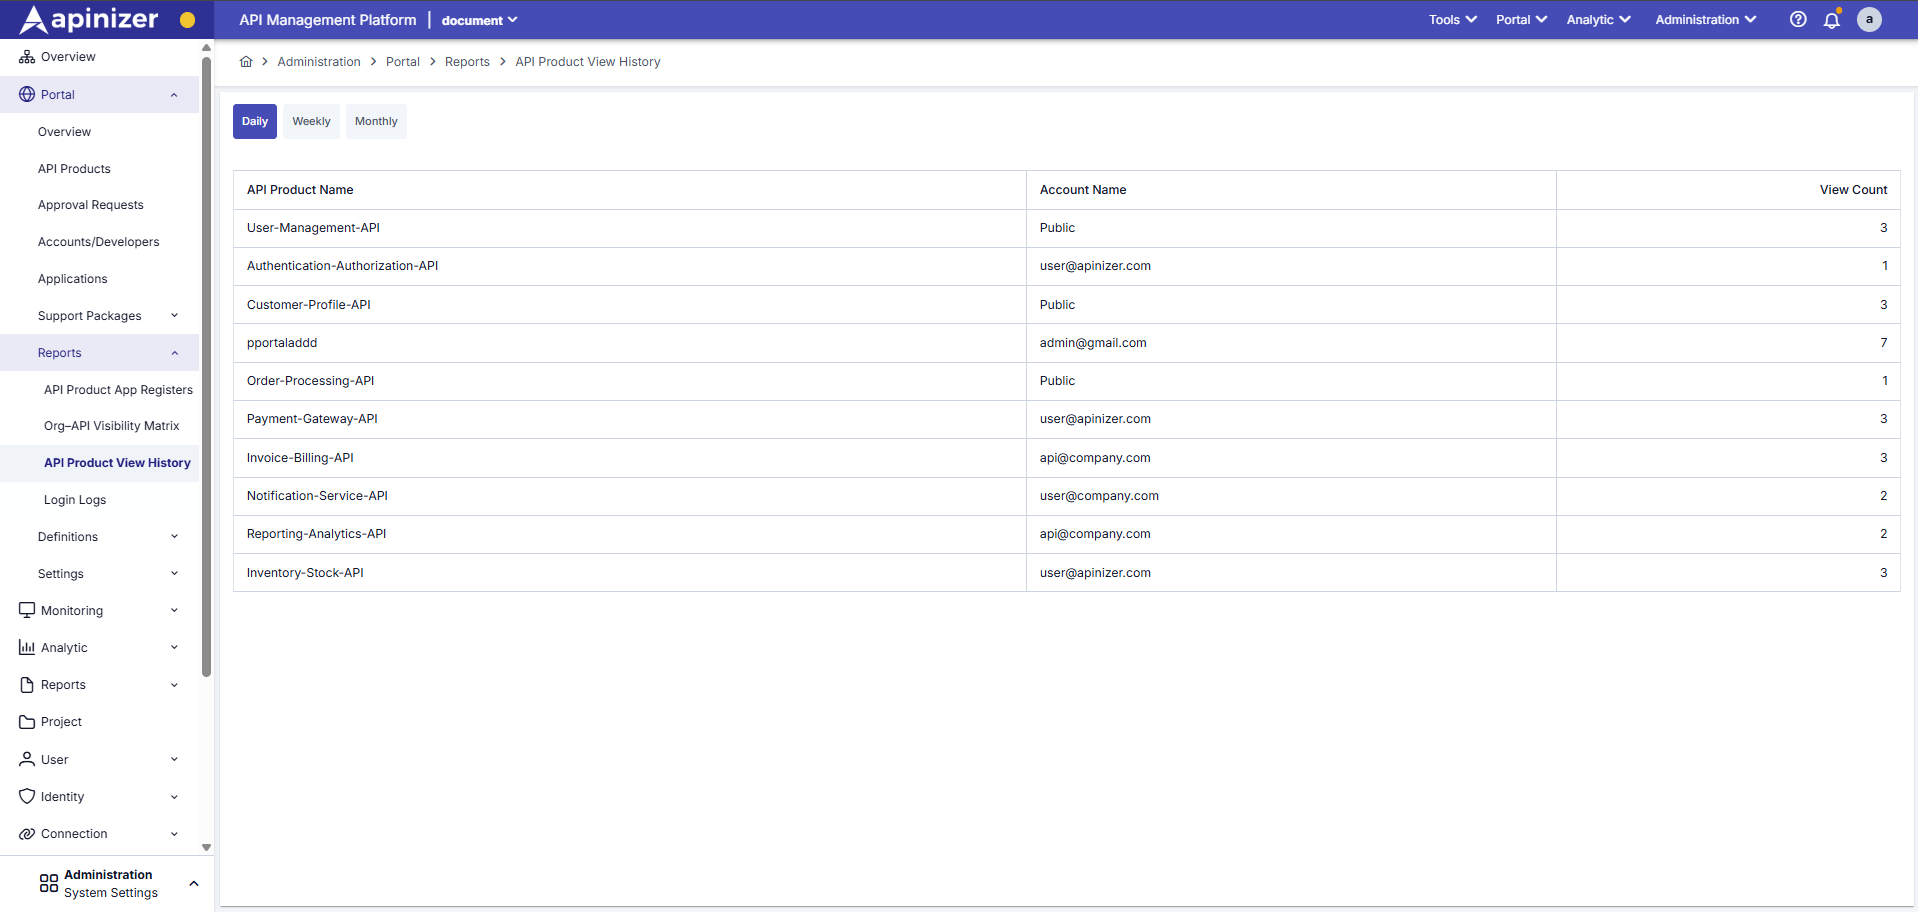
Time Periods
The time range of reported data is determined through buttons in the top left. Each period is optimized for different analysis needs.
Daily Analysis:
- Lists view counts separately for each day
- Used to monitor real-time traffic changes
- Daily peak hours and intensity analysis can be performed
Usage Scenarios:
- Daily interest tracking when a new API product is published
- Daily traffic analysis after announcements or campaigns
- Weekday vs. weekend comparison
Weekly Analysis:
- Shows data covering the last 7 days
- Suitable for analyzing weekly usage trends
- Weekday and weekend comparison can be performed
Usage Scenarios:
- Tracking weekly view trends
- Determining weekly most popular API products
- Weekly user segmentation analysis
Monthly Analysis:
- Presents monthly view totals
- Shows long-term usage and interest changes
- Seasonal trends and growth analysis can be performed
Usage Scenarios:
- Calculating monthly growth rates
- Analyzing seasonal changes
- Long-term strategic planning
Time period selection should be made according to the detail level you want to analyze. While daily analysis provides more detailed information, monthly analysis helps you see general trends.
Table Fields and Columns
Detailed descriptions of data fields in the report are as follows:
| Column | Description | Usage Purpose | Example |
|---|---|---|---|
| API Product Name | The name of the viewed API product. Shows the full name of the API product published on the portal. | Identifying products with highest access counts. Understanding which APIs are more popular. | Payment API, User Management API |
| Account Name | Identity of the user viewing the page. • Public: Anonymous (not logged in) visitors. • Email: Registered and logged in users. | Distinguishing whether traffic comes from anonymous visitors or existing developers. User segmentation analysis. | Public, developer@example.com |
| View Count | Total page view count in the relevant time period. Each page view is counted once. | Numerical magnitude of interest shown to product documentation. Popularity measurement and trend analysis. | 150, 1,234, 5,678 |
API Product Name
Description: This column shows the full name of the API product published on the portal. Each row represents a view record for a specific API product.
Features:
- API product name is the same as the name defined in Portal → API Products section
- Different user types (Public/Registered) for the same API product are shown in separate rows
- You can go to the relevant API product detail page by clicking on the API product name
Usage:
- Sort by View Count to identify most popular API products
- Filter to track performance of a specific API product
Account Name
Description: This column shows the identity of the user viewing the API product page. It can take two different values:
1. Public (Open to Everyone):
- Represents anonymous visitors who are not logged in
- Users who have not registered on the portal or are not logged in
- These visitors can view API documentation but cannot use the API
2. Email Address (Registered User):
- Represents users who have registered and logged into the portal
- Example:
developer@example.com,john.doe@company.com - These users can use the API and register applications
Usage Scenarios:
Traffic Source Analysis
Public vs. Registered User Comparison:
- If Public traffic is high: Portal promotion is working well, but registration rate may be low
- If registered user traffic is high: Existing developers are actively examining APIs
Action:
- If Public traffic is high, optimize the registration process
- If registered user traffic is high, analyze API usage rates
User Segmentation
Interest Areas of Different User Groups:
- Which API products do anonymous visitors look at more?
- Which API products do registered users look at more?
Action:
- Make better promotion for APIs that anonymous visitors are interested in
- Prepare more detailed documentation for APIs that registered users are interested in
View Count
Description: This column shows how many times the relevant API product page was viewed within the selected time period. Each page view is counted once.
Features:
- Shown as a numerical value (e.g.,
150,1,234,5,678) - Multiple views by the same user are counted separately
- Shows total view count according to time period
Usage:
- Sort by View Count to identify most popular API products
- Compare different time periods for trend analysis
- Calculate growth rates
View Count shows the number of page views. This is not the actual usage count (API calls) of the API. Use the Analytics module for actual API traffic.
Usage Scenarios and Analysis Examples
You can perform various analyses and make strategic decisions using the API Product View History page. Below, the most common usage scenarios are explained in detail.
Scenario 1: Interest Level Analysis and Popularity Determination
To determine which API products receive more interest and manage the product portfolio accordingly:
Select the time period you want to analyze:
- Daily: Last 24 hours or a specific day
- Weekly: Last 7 days
- Monthly: Last 30 days or a specific month
Use monthly period to see long-term trends.
Sort the table by View Count column (high to low):
- API products with highest view counts appear at the top
- This shows the most popular API products
Analyze the results:
Most Popular APIs:
- Which API products are viewed most?
- Is the documentation for these APIs sufficient?
- Are additional resources needed for these APIs?
Less Popular APIs:
- Which API products are viewed less?
- Is the promotion for these APIs sufficient?
- Is documentation improvement needed?
Take action based on analysis results:
For Popular APIs:
- Prepare more detailed documentation
- Add example code and tutorials
- Increase support resources
For Less Popular APIs:
- Conduct promotion and marketing activities
- Review and improve documentation
- Add usage examples and case studies
Scenario 2: User Segmentation and Traffic Analysis
To analyze the source distribution of portal traffic and perform user segmentation:
Filter or group the table by Account Name column:
Public (Anonymous) Traffic:
- Examine records where Account Name = "Public"
- Calculate total Public view count
Registered User Traffic:
- Examine records where Account Name = Email address
- Calculate total registered user view count
Calculate the ratio of both traffic types:
Example Calculation:
- Total views: 10,000
- Public views: 7,000 (70%)
- Registered user views: 3,000 (30%)
Interpretation:
- If Public traffic is high: Portal promotion is good, but registration rate may be low
- If registered user traffic is high: Existing developers are active
Perform separate analysis for each segment:
Public Traffic Analysis:
- Which APIs are viewed more by anonymous visitors?
- Are promotion materials sufficient for these APIs?
- Is it necessary to optimize the registration process?
Registered User Traffic Analysis:
- Which APIs are viewed more by existing developers?
- Is documentation sufficient for these APIs?
- Are API usage rates consistent with view rates?
Optimize based on segment analysis:
For Public Traffic:
- Optimize portal home page
- Improve API promotion pages
- Simplify registration process
- Organize registration incentive campaigns
For Registered User Traffic:
- Improve documentation quality
- Add example code and tutorials
- Prepare API usage guides
- Expand support resources
Scenario 3: Documentation Optimization
To review documentation content of products with high view counts but low usage rates:
Identify products with high View Count but low API usage:
Criteria:
- View Count: High (e.g., 1,000+)
- API Usage: Low (check from Analytics)
- Application Registrations: Few
Interpretation:
- Users are viewing the API but not using it
- Documentation may be insufficient or confusing
- Example code or usage guide may be missing
Review the documentation of the relevant API product:
Things to Check:
- Is documentation clear and understandable?
- Are there example codes and usage scenarios?
- Are API endpoints explained in detail?
- Is there error handling and troubleshooting information?
- Is there a Quick Start guide?
Plan documentation improvements:
Can Be Added:
- More detailed API descriptions
- Step-by-step usage guides
- Example code and snippets
- Common use cases
- Troubleshooting section
- FAQ (Frequently Asked Questions)
Track results after improvements:
- Did view count change?
- Did API usage rate increase?
- Did application registrations increase?
- How are user feedbacks?
Scenario 4: Promotion Impact Analysis
To measure the impact of announcements or newly published features on portal traffic:
Compare data before and after announcement or new feature:
Before Period:
- View counts for 7 days before announcement
- Daily average views
After Period:
- View counts for 7 days after announcement
- Daily average views
Calculation:
- Growth rate = ((After - Before) / Before) × 100
Analyze the impact of the announcement:
High Impact Indicators:
- Significant increase in view count
- Increase in relevant API products
- Increase in new user registrations
Low Impact Indicators:
- No change in view count
- No increase in user interest
Optimize campaign based on analysis results:
If High Impact:
- Organize similar campaigns
- Use successful channels more
- Expand content
If Low Impact:
- Change campaign channels
- Review message
- Re-evaluate target audience
Usage Areas and Strategic Decisions
Data obtained from this report can be used as input in the following management decisions:
Identifying which API products are examined more frequently by developers and managing the product portfolio accordingly. Allocate more resources for popular APIs, promote less popular APIs.
Analyzing the source distribution of portal traffic (Anonymous vs. Registered User). Develop and optimize different strategies for each segment.
Reviewing documentation content of products with high view counts but low usage rates. Increase usage rates by improving documentation quality.
Measuring the impact of announcements or newly published features on portal traffic. Evaluate and optimize campaign success.
Deciding which API products to invest more in. Support popular APIs, review less used APIs.
Planning the distribution of documentation, support, and development resources. Allocate more resources for APIs that receive most interest.
Technical Notes and Important Warnings
View and Usage (Runtime) Distinction
Data in this report refers to visits made to the API product's documentation page (View Count). These numbers do not cover technical requests made to API endpoints (Request).
Difference:
- View Count: Number of visits to documentation page
- API Request Count: Actual number of calls made to API endpoints
For Actual API Traffic:
- Analytics module should be used for actual API traffic, error rates, and performance metrics.
- Traffic Logs screen should be examined for real-time request/response details.
- API Management → Analytics section should be checked for API usage statistics.
Data Update:
View data is updated in real-time. However, there may be a short delay for calculating totals (usually a few minutes).
Best Practices:
- Regularly review view reports (weekly or monthly)
- Compare different time periods for trend analysis
- Analyze View Count together with API usage rates
- Combine view data with user feedback
Conclusion
The API Product View History page is a powerful tool for portal administrators to analyze API product popularity, user interest, and traffic trends. By using this page regularly, you can:
✅ Identify which APIs are more popular
✅ Perform user segmentation and analyze traffic sources
✅ Make data-driven decisions for documentation optimization
✅ Measure the impact of promotion campaigns
✅ Develop product portfolio and resource planning strategies
Make strategic decisions and optimize product portfolio using view data
Understand which APIs users are interested in and allocate resources according to their needs
Continuously improve portal performance through regular analysis
Gain competitive advantage by supporting popular APIs