Apinizer's Prometheus and Grafana Integration: A Comprehensive Guide

In today's microservices architecture, monitoring system performance and behavior is vital for sustaining optimal operations. Apinizer, as a powerful API management platform, offers robust metric collection capabilities that integrate with industry-standard monitoring tools such as Prometheus and Grafana. This article provides a detailed guide on how to leverage Apinizer's metric features to gain valuable insights into your API gateway and cache performance.
Overview of Apinizer's Metric System
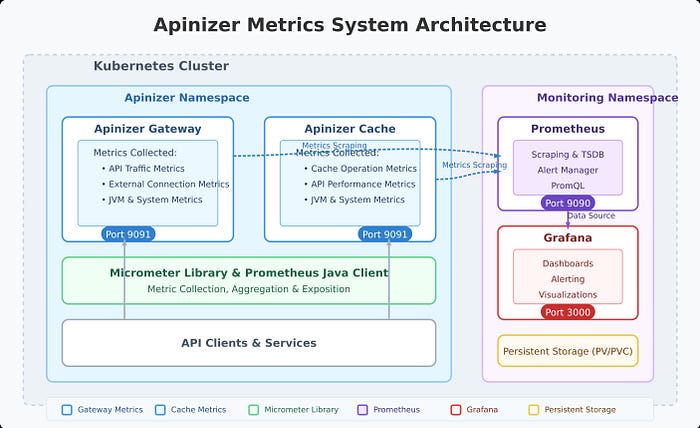
Apinizer's metric system is built on Micrometer. The platform collects a broad range of metrics through two main components:
- Apinizer Gateway: Collects metrics related to API traffic, external connections, JVM health, and system resources
- Apinizer Cache: Monitors cache operations, API requests, JVM performance, and system health
These metrics provide comprehensive visibility into the performance and health of your API management infrastructure, enabling proactive identification of bottlenecks, troubleshooting, and capacity planning.
Metrics Collected by Apinizer
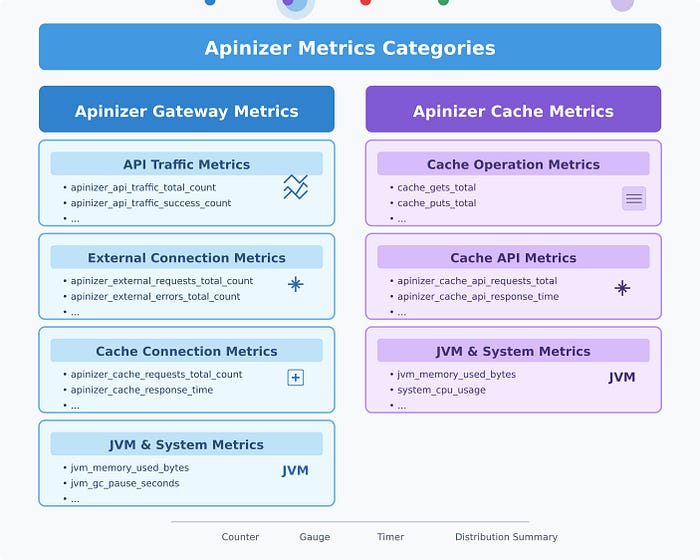
Apinizer Gateway Metrics
The Gateway component collects metrics in several categories:
API Traffic Metrics — Track requests passing through the gateway:
- Total API traffic requests
- Successful/failed/blocked API requests
- Request processing times (pipeline, routing, total)
- Request and response sizes
- Cache hit statistics
Each metric is available in two forms: aggregate metrics and tagged metrics with detailed dimensions (e.g., API ID, requests per API name).
External Connection Metrics — Track connections to external services: total external requests, external error count, external response times.
JVM Metrics — Memory usage (heap, non-heap), garbage collection statistics, thread counts and states.
System Metrics — CPU usage, processor count, system load average, file descriptor counts.
Apinizer Cache Metrics
Cache Operation Metrics: Cache get/put counts, size and entry counts, operation latencies, memory usage.
API Metrics: API request counts, response times, error counts.
JVM and System Metrics: Similar to the Gateway, the Cache component tracks JVM performance and system resource usage.
Setting Up Prometheus Integration
1. Enabling Metrics on Apinizer Components
For Apinizer Gateway: In the Apinizer UI, go to Gateway Environments and enable the "Prometheus Metric Server" option. This enables metric publishing on port 9091.
For Apinizer Cache: Edit the Cache deployment and add the METRICS_ENABLED=TRUE environment variable.
- Via Apinizer UI: Gateway Environments → Deployments & Services → Cache → Edit deployment
- Via Kubernetes CLI:
kubectl edit deploy -n <namespace> cache
# Add the following environment variable
- name: METRICS_ENABLED
  value: "true"
2. Configuring Prometheus to Scrape Metrics
Constant Scraping: Create a service targeting Apinizer components on port 9091, then configure Prometheus to scrape metrics from these services.
Dynamic Scraping with Kubernetes Service Discovery: Add annotations prometheus.io/port: "9091" and prometheus.io/scrape: "true" to the deployment; configure Prometheus to use Kubernetes service discovery.
Analyzing Apinizer Metrics with PromQL
Gateway API Traffic Analysis — Example queries: total API requests in the last hour, requests per API, success rate (%), average response time per API (ms).
Cache Performance Analysis — Cache get operations, hit rate (%), current cache entries.
JVM Analysis — Memory usage (%), garbage collection time.
Creating Grafana Dashboards
After configuring Prometheus as a data source in Grafana:
API Traffic Dashboard: Request volume by type, most-used APIs, processing time distribution, request/response size panels.
Cache Performance Dashboard: Cache operations (get/put), hit rate, memory usage.
System Health Dashboard: JVM memory usage, CPU usage, active threads.
Example PromQL expressions: sum(rate(apinizer_api_traffic_total_count_total[5m])), topk(5, sum by (api_name) (increase(apinizer_api_traffic_total_count_tagged_total[5m]))), etc.
Best Practices
-
Metric Retention: Configure appropriate retention in Prometheus (e.g.
--storage.tsdb.retention.time=7d). Consider remote storage for longer retention. -
Alert Configuration: Set up alerts in Prometheus AlertManager or Grafana for critical metrics (high API error rate, high memory, slow response times).
-
Dashboard Organization: Separate dashboards for Gateway and Cache, group related metrics, use variables for filtering by namespace/pod/API.
-
Label Usage: Filter by API using
api_name, analyze by namespace/pod, compare across environments.
Conclusion
Integrating Apinizer with Prometheus and Grafana provides powerful monitoring capabilities for your API management infrastructure. This integration leverages the strengths of each component:
- Apinizer's comprehensive metric collection
- Prometheus's efficient time-series database and powerful query language
- Grafana's flexible and rich visualizations
By configuring metric collection correctly, building informative dashboards, and applying alerts, you can ensure optimal performance, quickly detect issues, and make data-driven decisions for your API ecosystem.