To monitor, or not to monitor, that is the question

What do the two comic-book characters above have in common, beyond their dressed-up, cool, stern poses? In short: Batman watches Gotham, and Heimdall watches and listens to the Nine Realms. Batman is arguably more popular; Heimdall may seem to live in Thor's shadow—but that's beside the point. What matters is: both do it so they can intervene by both watching and listening.
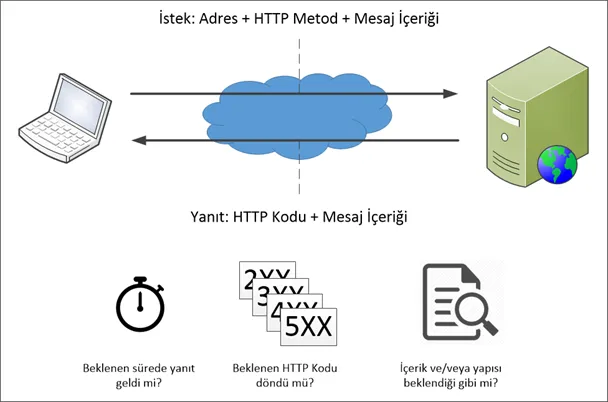
When you do that same watching and listening for your APIs and web services, and when a problem occurs you inform the responsible parties instead of “beating them up,” that is called API Monitoring.
When discussing API Gateway, I will use the terms API and Web Service interchangeably despite small differences. With REST we speak of “endpoints,” with SOAP of “operations”; I will refer to all of them as “methods.”
We developers would of course love to have such superheroes—to assign one to watch and listen to the APIs we write, or even to systems that are not web services, and to have them fix issues and keep everything on track. In real life, we don’t have those heroes, and the same is true in the API world. So instead of waiting for them, we have to do API monitoring ourselves.
“Why would we need all this monitoring? We wrote the code, tested it, released it, and customers have been using it. We haven’t had any problems so far.” Sound familiar? That’s why I first want to answer “What is API monitoring? Is it really necessary?” with some realistic scenarios, and then describe a few ways to do it.
What is API monitoring? Is it really necessary?
Every developer tests the code they write. The same holds for APIs and web services: we run detailed tests or at least send a request to the running service and check that it’s reachable and returns the expected result. After testing, we hand over access details, credentials, and documentation, and put the service in production.
So what’s the point of monitoring services after all that testing? Here are a few scenarios that come to mind:
- Unexpected conditions: A client might send data that leads to errors occasionally or constantly—cases that weren’t covered in tests.
- Server slowdown: The server may slow down for some reason; even if the API is correct, timeouts occur and clients see frequent errors.
- Dependent services: Your service may call one or more other web services. If any of those upstream services fails to respond or times out, your service will appear broken to its callers.
- Network changes: Network or firewall changes can make your service unreachable.
- Server failure: The server may become unable to serve. How good your API is no longer matters if clients can’t reach it.
- Shared resource changes: Another application using the same database might change the schema; that can break some of your methods.
You can think of more. Many of these are hard to catch with tests alone, and many web services don’t have thorough automated tests—often just a few manual checks with Postman or similar.
What is API monitoring?
API monitoring is the practice of continuously checking that your APIs/web services return the expected responses and response times, and of running predefined actions (e.g. sending email/SMS, creating alerts) when something goes wrong, so that the right people are informed.
Is API monitoring really necessary?
Ask yourself:
- Do other organizations, teams, or projects depend on your APIs or web services?
- Are your APIs critical to the business?
- Have you seen outages, timeouts, or occasional wrong responses?
If you answered “Yes” to any of these, API monitoring is necessary—and often mandatory. If you’re not aware of a failure and don’t fix it, you may get escalations, calls, and complaints; depending on criticality, that can mean loss of trust, reputation, or customers.
How to do API monitoring?
The definition has two parts: monitoring/problem detection, and notification. First we look at monitoring methods.
Monitoring and troubleshooting
Monitoring and problem detection can be grouped into roughly three approaches.
Active monitoring
You send predefined requests at regular intervals to the API/web service you monitor and validate the responses against expected behavior.
Step 1 — Sending requests
- Call a dedicated endpoint (e.g. /healthCheck): You add a special endpoint (e.g.
/health,/healthcheck,/ok,/status) that returns a simple HTTP 200. You learn whether the service is up. It cannot detect a single method failing (e.g. scenarios 1, 3, or 6 above). - Call selected methods: You choose the most critical methods and define a monitoring check for each (request payload + validation against expected response). This can catch cases where the service is up but one or more methods are broken. A few requests every few minutes have little performance impact; catching issues early is far more valuable. Think carefully about what requests to send to methods that modify data.
- Call methods in sequence: You may need to call a sequence of methods and use one method’s output as input to the next, to test a full flow. This is more complex and less common but useful in specific scenarios.
Step 2 — Response validation
- Timeout: Responses must arrive within a defined time (e.g. 30 seconds). You can alert on the first failure, or retry a few times (e.g. 3–5) and only then alert, to reduce false alarms from temporary network glitches.
- HTTP status code: Check that the returned code matches what you expect (200, 400, 404, 500, etc.). If you expect 201 and get 500, that method has a problem.
- Response content and structure: Even if the status code is correct, verify that the body has the expected content or structure, so you catch bugs that return the right code but wrong data.
Passive monitoring
This is better thought of as listening. You don’t send requests to your APIs; you expect requests from the systems you monitor. The advantage: you can also monitor systems that cannot initiate service calls.
How it works: For each system you monitor, you expose a small web service or endpoint and tell that system to call it periodically (e.g. via cron + curl). As long as requests keep coming, the monitored system is considered up; you may not even need to return a meaningful response. If no request arrives within the expected interval, you assume a problem in the monitored system.

Monitoring message traffic logs
You can monitor your APIs or clients by inspecting logs of incoming and outgoing messages. Request/response traffic can be filtered by HTTP codes, response time, content, client IP, user, error code, method, message size, etc., and compared to thresholds so that anomalies are detected and the right people are notified.

Notification
When a service is unreachable, the server is down, a method has failed, or a passively monitored application has stopped sending requests, you often can’t fix it programmatically. The best you can do is raise an alert and notify the right people.

Email or SMS alone may not be enough. Creating alerts directly in call and alert management tools such as Opsgenie or PagerDuty is often more effective. You might also write to your own ticketing or logging system. When building your API monitoring setup, design for flexibility so that new notification channels can be added easily.
Logging
Storing all monitoring, validation, and alert events is very useful in practice. You will need to look back at when a problem occurred, which service and method were involved, what request was sent, what response was received, why it was considered wrong, and who was notified and how. Logs can grow quickly, so defining a retention period and purging older records is often advisable, depending on disk space and policy.
Conclusion
API Monitoring is indispensable in many situations for keeping things running smoothly. I don’t recommend building your own API monitoring application from scratch to cover everything described here. If that’s not your core business, using an existing API monitoring solution will be more efficient and cost-effective.
We at Apinizer also have an API Monitoring product. One of the strengths of Apinizer API Monitor is its direct integration with Apinizer API Gateway. You can use it as part of your platform rather than a separate tool: when defining API proxies, you can define and manage monitors easily, turn your proxy definitions into monitoring definitions, and reuse the log queries you set up for analytics for monitoring as well.
Try it: https://demo.apinizer.com