Endpoints Not Receiving Requests
The maximum number of records this report can return is 512.
Since an API Proxy can be loaded into multiple environments, metrics must also be evaluated according to the environment it is loaded into. Therefore, in all analytics screens, metrics are filtered by first selecting environment information.
Filters
This report allows you to detect endpoints that do not receive requests or receive few requests based on specific criteria. You can configure the filters by following the steps below:
You must first select an environment to run the report. Environment selection is mandatory and metrics are filtered according to the selected environment.
Since an API Proxy can be loaded into multiple environments, metrics must also be evaluated according to the environment it is loaded into.
Multiple project selection is available for administrator users. When a project is selected, API Proxies in the selected projects are automatically loaded.
This filter is only visible for administrator users.
You can specify the API Proxies to be analyzed by making multiple selections. If no selection is made, all API Proxies are analyzed.
You can filter by the status of API Proxies:
- All: API Proxies in all statuses
- Deployed: API Proxies that are actively running
- Undeployed: API Proxies that are in passive status
You can define a minimum usage count threshold to determine the usage status of endpoints. Endpoints that receive requests below the specified value are listed.
This threshold allows you to detect endpoints that are completely unused or rarely used.
You can define a maximum usage count threshold to determine the usage status of endpoints. Endpoints that receive requests above the specified value are listed.
This threshold allows you to detect endpoints within a specific usage range.
You can select the date range to be analyzed. When a date range is selected, only requests within this range are analyzed.
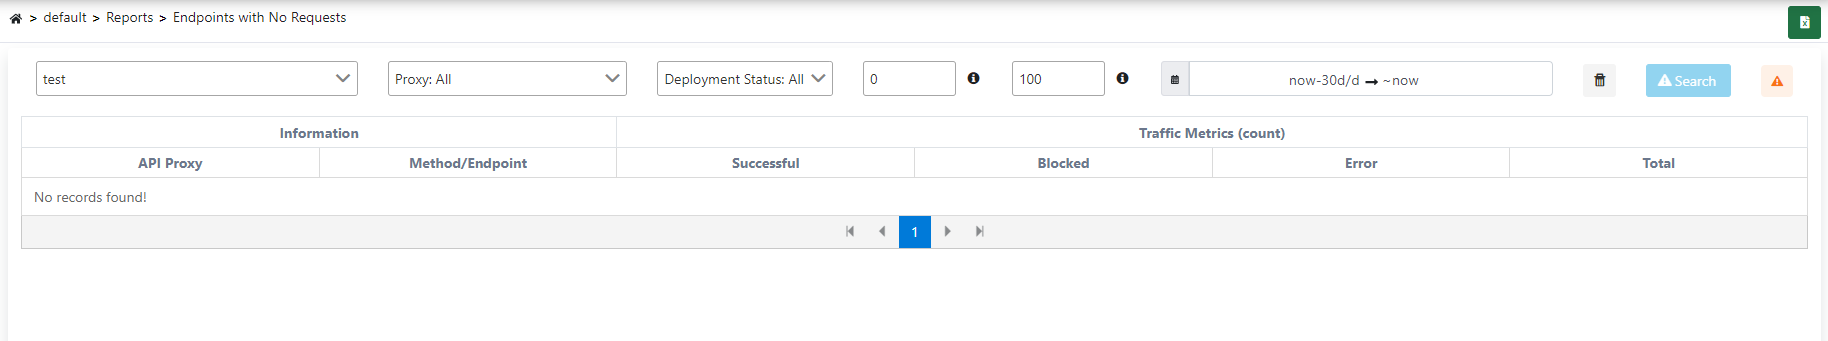
Report Table
Report results are displayed in the following columns:
| Field | Description |
|---|---|
| Project (Project) (Admin) | The name of the project to which the endpoint belongs (only visible for administrator users) |
| API Proxy Name (API Proxy) | The name of the API Proxy to which the endpoint belongs |
| Method Name (Method/Endpoint) | The method information of the endpoint (HTTP method and path information) |
| Successful (Successful) | The number of requests that completed successfully |
| Blocked (Blocked) | The number of requests blocked due to security policies or rate limiting |
| Error (Error) | The number of requests that resulted in an error |
| Total (Total) | Total number of requests (successful + blocked + error) |
The report cannot be run for environments where Elasticsearch integration is not active. In this case, a warning message is displayed on the screen.