API Proxy Creation Report
View Options
This report offers two different views:
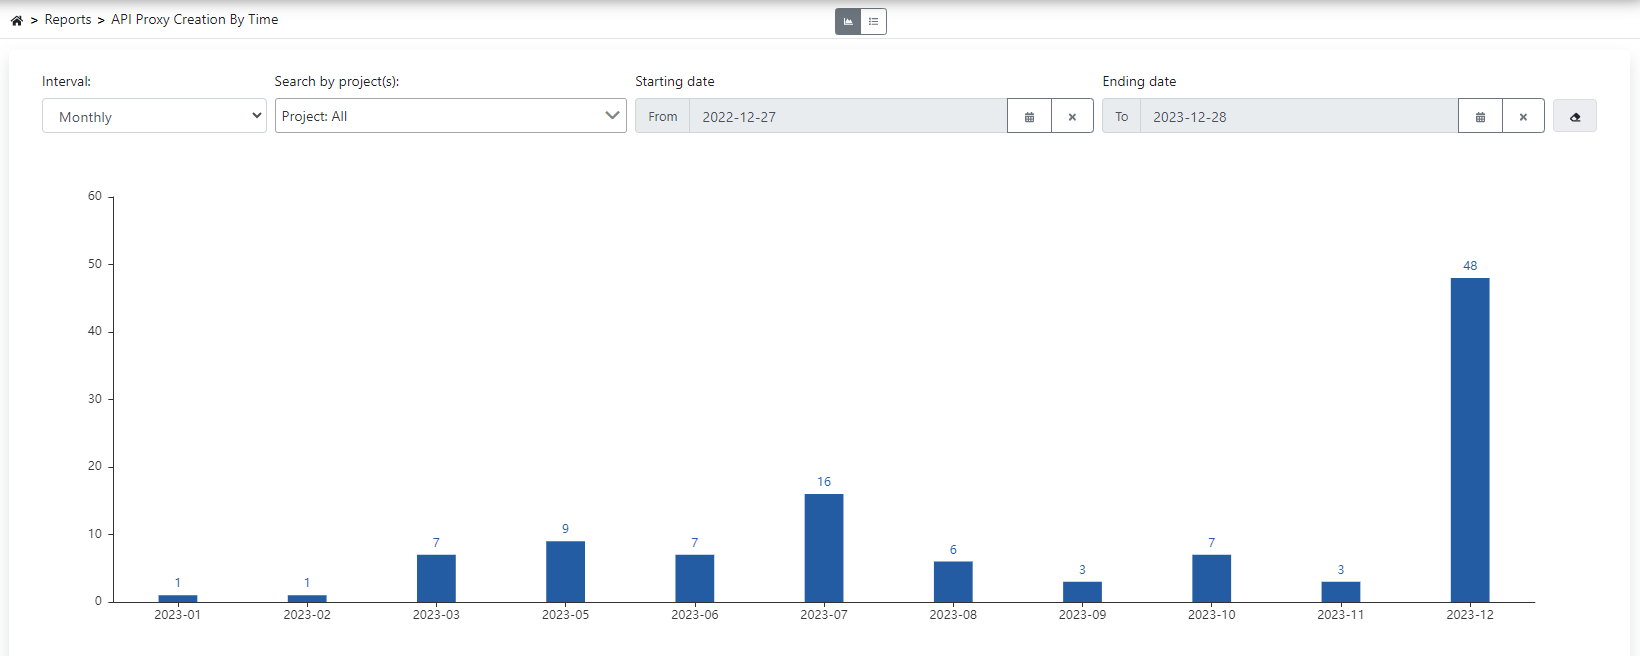
Graph View
Shows graphically how many API Proxies were created monthly in the date range determined from filters.
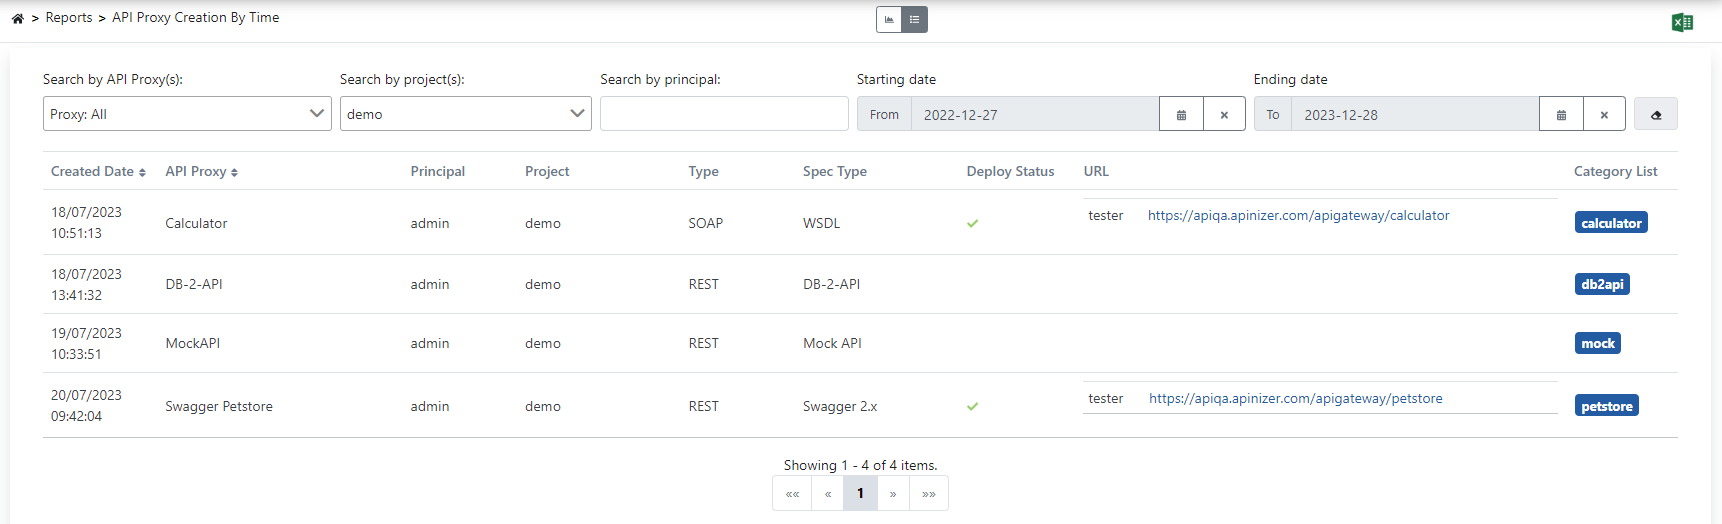
List View
Lists data in the graph view in detail in table format.