Endpoint Traffic & Time Metrics
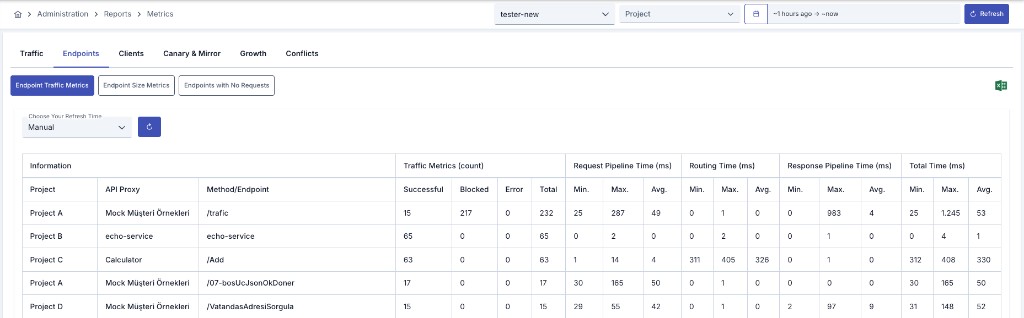
Since an API Proxy can be loaded into multiple environments, metrics must also be evaluated according to the environment it is loaded into. Therefore, in all analytics screens, metrics are filtered by first selecting environment information.
Metric data cannot be displayed for environments where Elasticsearch integration is not configured. In this case, a warning message is displayed on the screen.
Metrics Page
This report is the Endpoint Traffic tab of the Metrics page (full name: Endpoint Traffic Metrics). Open it via Administration > Reports > Metrics or Reports > Metrics in the project menu.
Related tabs: Message Size and Inactive Endpoints.
While the Traffic & Time Metrics report groups records by API Proxy, this report shows the same traffic and duration metrics broken down by Project / API Proxy / Method/Endpoint.
Filtering
The filter row at the top of the Metrics page is shared across all tabs and sub-reports:
| Option | Description |
|---|---|
| Environment | The environment whose metrics are calculated. The report is queried against the selected environment's Elasticsearch data |
| Project | (Admin menu only) Filter metrics across multiple selected projects |
| Date Range | The time range over which metrics are calculated. Defaults to the last 1 hour |
| Refresh | Re-queries the currently displayed sub-report with the selected filters |
| Excel Export | Export on the shared filter row; downloads the list for the active sub-report |
The sub-report row includes Choose Your Refresh Time (default: Manual) and a refresh button.
Table Column Descriptions
Information
| Column | Description |
|---|---|
| Project | Name of the project the record belongs to (only shown in the Admin menu) |
| API Proxy | Name of the related API Proxy |
| Method/Endpoint | The combination of HTTP method and endpoint path (e.g., GET /pet/findByStatus) |
Traffic Metrics (count)
Numeric breakdown of the requests received by this method/endpoint within the selected date range:
| Column | Description |
|---|---|
| Successful | Number of requests resulting in a successful (2xx) response code |
| Blocked | Number of requests blocked due to security policies, rate limiting/quota, etc. |
| Error | Number of requests resulting in an error (4xx, 5xx) response code |
| Total | Total number of requests (Successful + Blocked + Error) |
Request Pipeline Time (ms)
The time spent processing request-side policies (auth, transformation, validation, etc.) between the request reaching Apinizer and it being routed to the backend:
| Column | Description |
|---|---|
| Min. | The smallest observed value for this duration |
| Max. | The largest observed value for this duration |
| Avg. | The average value for this duration |
Routing Time (ms)
The time between the request being sent to the backend and the response being received from the backend (the backend call/network time):
| Column | Description |
|---|---|
| Min. | The smallest observed value for this duration |
| Max. | The largest observed value for this duration |
| Avg. | The average value for this duration |
Response Pipeline Time (ms)
The time spent for the response coming back from the backend to pass through response-side policies (transformation, masking, etc.) before being returned to the client:
| Column | Description |
|---|---|
| Min. | The smallest observed value for this duration |
| Max. | The largest observed value for this duration |
| Avg. | The average value for this duration |
Total Time (ms)
The end-to-end total time from the request reaching Apinizer to the response being returned to the client (Request Pipeline + Routing + Response Pipeline):
| Column | Description |
|---|---|
| Min. | The smallest observed value for this duration |
| Max. | The largest observed value for this duration |
| Avg. | The average value for this duration |