Canary & Mirror Metrics
Since an API Proxy can be loaded into multiple environments, metrics must also be evaluated according to the environment it is loaded into. Therefore, in all analytics screens, metrics are filtered by first selecting environment information.
Metric data cannot be displayed for environments where Elasticsearch integration is not configured. In this case, a warning message is displayed on the screen.
Metrics Page
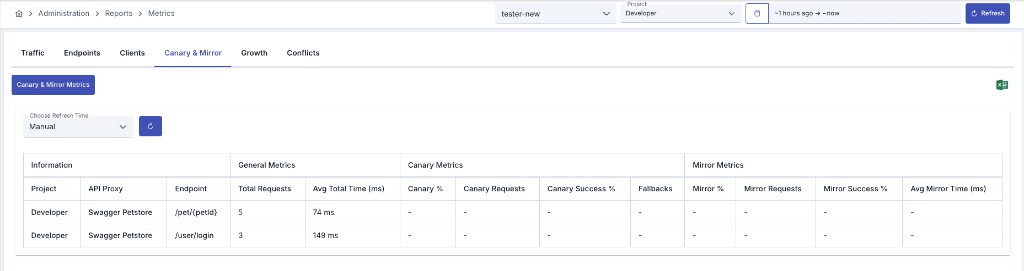
This report is the Canary & Mirror tab of the Metrics page (full name: Canary & Mirror Metrics). Open it via Administration > Reports > Metrics or Reports > Metrics in the project menu.
For what canary and mirror configuration does, see Canary Release and Traffic Mirroring. For canary/mirror filters on individual requests, use the advanced filters on the Traffic page.
Each row aggregates metrics for one endpoint (API Proxy + Endpoint / method path) that received traffic in the selected environment and date range. The query returns at most 500 endpoints.
Filtering
The filter row at the top of the Metrics page is shared across all tabs:
| Option | Description |
|---|---|
| Environment | Environment whose metrics are calculated |
| Project | (Administration only) Filter by selecting multiple projects |
| Date Range | Time range for metric calculation (default: last 1 hour) |
| Refresh | Re-queries the currently displayed sub-report with the selected filters |
| Excel Export | Export on the shared filter row; downloads a ZIP containing canary-mirror-metrics-report.xlsx |
The sub-report row includes Choose Your Refresh Time (default: Manual) and a refresh button. Automatic refresh options: 1, 3, and 5 minutes.
Table Column Descriptions
The table is grouped under four header sections.
Information
| Column | Description |
|---|---|
| Project | Project the endpoint belongs to (Administration only) |
| API Proxy | API Proxy name |
| Endpoint | Method / endpoint path |
General Metrics
| Column | Description |
|---|---|
| Total Requests | Total requests to the endpoint in the selected range |
| Avg Total Time (ms) | Average total time inside the gateway (timeApiProxyTotal average, rounded ms) |
Canary Metrics
Canary columns use a yellow background highlight. When the value is 0, the UI shows -.
| Column | Description |
|---|---|
| Canary % | Share of total requests marked as canary (isCanaryRequest=true); one decimal place |
| Canary Requests | Count of canary-marked requests |
| Canary Success % | Share of canary requests with resultType=SUCCESS; calculated only when canary requests exist |
| Fallbacks | Requests that fell back from canary — sum of CIRCUIT_OPEN_FALLBACK, COOLDOWN_PERIOD_FALLBACK, and ERROR_THRESHOLD_FAILBACK |
Mirror Metrics
Mirror columns use a blue background highlight. When the value is 0, the UI shows -.
| Column | Description |
|---|---|
| Mirror % | Share of total requests with at least one mirror copy (mirrorCount > 0); one decimal place |
| Mirror Requests | Count of requests that triggered mirroring (log document count) |
| Mirror Success % | Successful mirror copies (mirrorSuccessCount sum) over total mirror copies (mirrorCount sum) |
| Avg Mirror Time (ms) | Average total mirror duration (mirrorTotalDuration average, rounded ms) |
If an endpoint had no canary or mirror traffic, the related columns show -; general columns (Total Requests, Avg Total Time) are still populated.