Overview
The Metrics Page
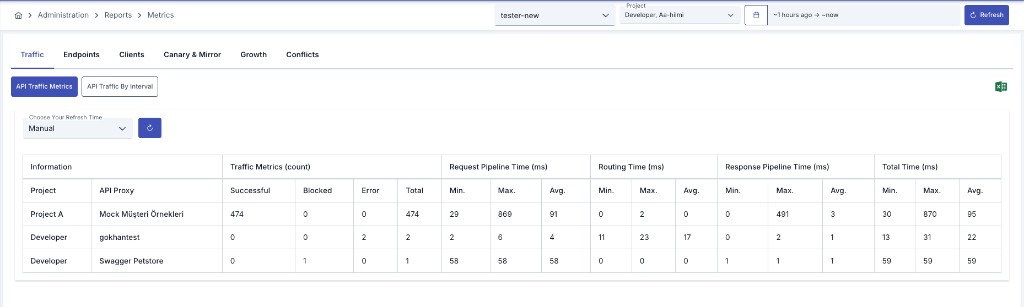
All analytics reports are reached through a single Metrics page with one tab per report. In the left menu, Reports is a separate group (it requires the Advanced Analytics license): open the page via Administration > Reports > Metrics or Reports > Metrics in the project menu. The group has two entries:
Tabbed page hosting all traffic, endpoint, client, canary/mirror, and growth reports
Creates custom scheduled reports (menu entry: Generator)
The tabs of the Metrics page and the reports they show are as follows. Hover over a tab to see the full report name.
| Tab | Report |
|---|---|
| API Traffic | API Traffic Metrics |
| Traffic Trend | API Traffic By Interval — interval, breakdown and value-unit selectors, peak-windows panel, and chart/list view toggle |
| Endpoint Traffic | Endpoint Traffic Metrics |
| Message Size | Endpoint Size Metrics |
| Inactive Endpoints | Endpoints with No Requests |
| Consumer Traffic | Client Traffic Metrics |
| IP Traffic | IP Traffic Metrics |
| Inactive Consumers | Clients with No Requests |
| Canary & Mirror | Canary & Mirror Metrics |
| API Growth | API Proxy Growth (with a chart/list view toggle) |
| Endpoint Growth | API Endpoint Growth (with a chart/list view toggle) |
Route Conflicts and Route Match Test are no longer on the Metrics page. They moved to Administration > Gateway Infrastructure > Route Analysis; see Route Analysis.
API and AI Views
When your license includes both the API Gateway and the AI Gateway, the first control in the top row of the Metrics page is an API | AI switch. The page shows one view at a time and loads only the selected one.
- API: The tabs above (REST, SOAP, gRPC, and WebSocket traffic).
- AI: The AI Gateway analytics for AI, MCP, and A2A traffic, with the tabs Performance, Cost & Consumers, Usage Reports, Security & Guardrails, and Provider Health.
The switch lists only the views your license covers. If only one view is licensed, the switch is hidden and that view opens. The same switch is on the Analytic > Dashboard and Analytic > Traffic pages; see Dashboard and Traffic.
Shared Filter and Refresh
A filter row shared across every tab sits at the top of the page: Environment, Project (Admin menu only), and date range. This filter is chosen once, and stays in effect no matter which tab you switch to.
The default date range is the last 1 hour. Choosing a wide range can slow queries down, especially on installations with high traffic volume. Widen the range manually whenever you need a longer window.
The Excel Export button also lives in this shared row and exports whichever report is currently on screen, using the filters of the view that is currently active: in chart view only the project and date filters apply, while in list view every list filter is applied.
The growth tabs (API Growth / Endpoint Growth) have no created-date picker of their own — they are driven entirely by the shared date range and Refresh button above. The first time you open a growth tab, if the shared range has not been changed yet, its window is widened automatically to the last year, since the shared default of the last hour is too narrow for a creation trend.
Lazy Tab Loading
When the Metrics page opens, only the currently active tab is mounted and runs its query — the other tabs are not loaded yet. Switching to another tab unmounts the previous report and mounts the newly selected one, which then runs its own query. As a result, at most one query runs in the background at any given moment.
Refresh follows the same principle: it reloads only the report currently on screen and has no effect on the other, unmounted reports.
Reporting Scope
The Metrics page has the same tabs in both the Project menu and the Admin menu; the difference is scope:
Reporting is limited to metrics under the active project
Reporting covers all projects, with a project selection filter
Report Detail Pages
Each of the following pages provides a detailed field and behaviour description for the tab it corresponds to in the table above:
Traffic Trend tab — visualizes traffic grouped by interval (API Traffic By Interval)
API Traffic tab — presents traffic metrics grouped by API Proxy
Endpoint Traffic tab — analyzes endpoint-based traffic metrics
Consumer Traffic tab — shows username-based traffic metrics
IP Traffic tab — analyzes IP address-based traffic metrics
Canary & Mirror tab — endpoint-level canary and mirror traffic metrics
Message Size tab — shows endpoint request and response size metrics
API Growth tab — visualizes API Proxy creation statistics
Endpoint Growth tab — visualizes API Endpoint creation statistics
Inactive Endpoints tab — detects unused endpoints
Inactive Consumers tab — detects passive clients
Administration > Gateway Infrastructure — detects route conflicts and tests route matching
Creates custom scheduled reports