Traffic Log Settings
Log Record Regions
Message information coming to and going from API Proxies defined on Apinizer is logged in Elasticsearch database according to message elements (header, parameter, body).
These log record regions:
Request information coming from client to API Proxy
Request information sent from API Proxy to Backend API
Response information given from Backend API to API Proxy
Response information sent from API Proxy to client
By default, logging of fields in all message regions of the project is active. Logged fields can be restricted based on need or log server resource consumption.
Log settings are managed on a project and environment (environment) basis through this screen.
For production environment, it is recommended to disable logging of elements belonging to the following regions.
- From API Proxy to Backend API (Request to Target)
- From Backend API to API Proxy (Response from Target)
If an API Proxy is running in production environment, it means that all policy settings and tests in the API Proxy are completed and no more development will be done.
Therefore, to prevent excessive growth of data in the database, it is recommended not to write header, parameter, and body data in these two regions.
Even if all logging fields are closed, if an error occurs in the request, all log fields are recorded to detect the error. This feature can be opened and closed in general settings.
Due to variable data sizes and data formats, file parts of formdata requests are never logged. Only other metadata fields are logged.
Since WebSocket and gRPC requests are stored as data coming to Apinizer and data going out from Apinizer, there are only 2 regions in these types of API Proxies.
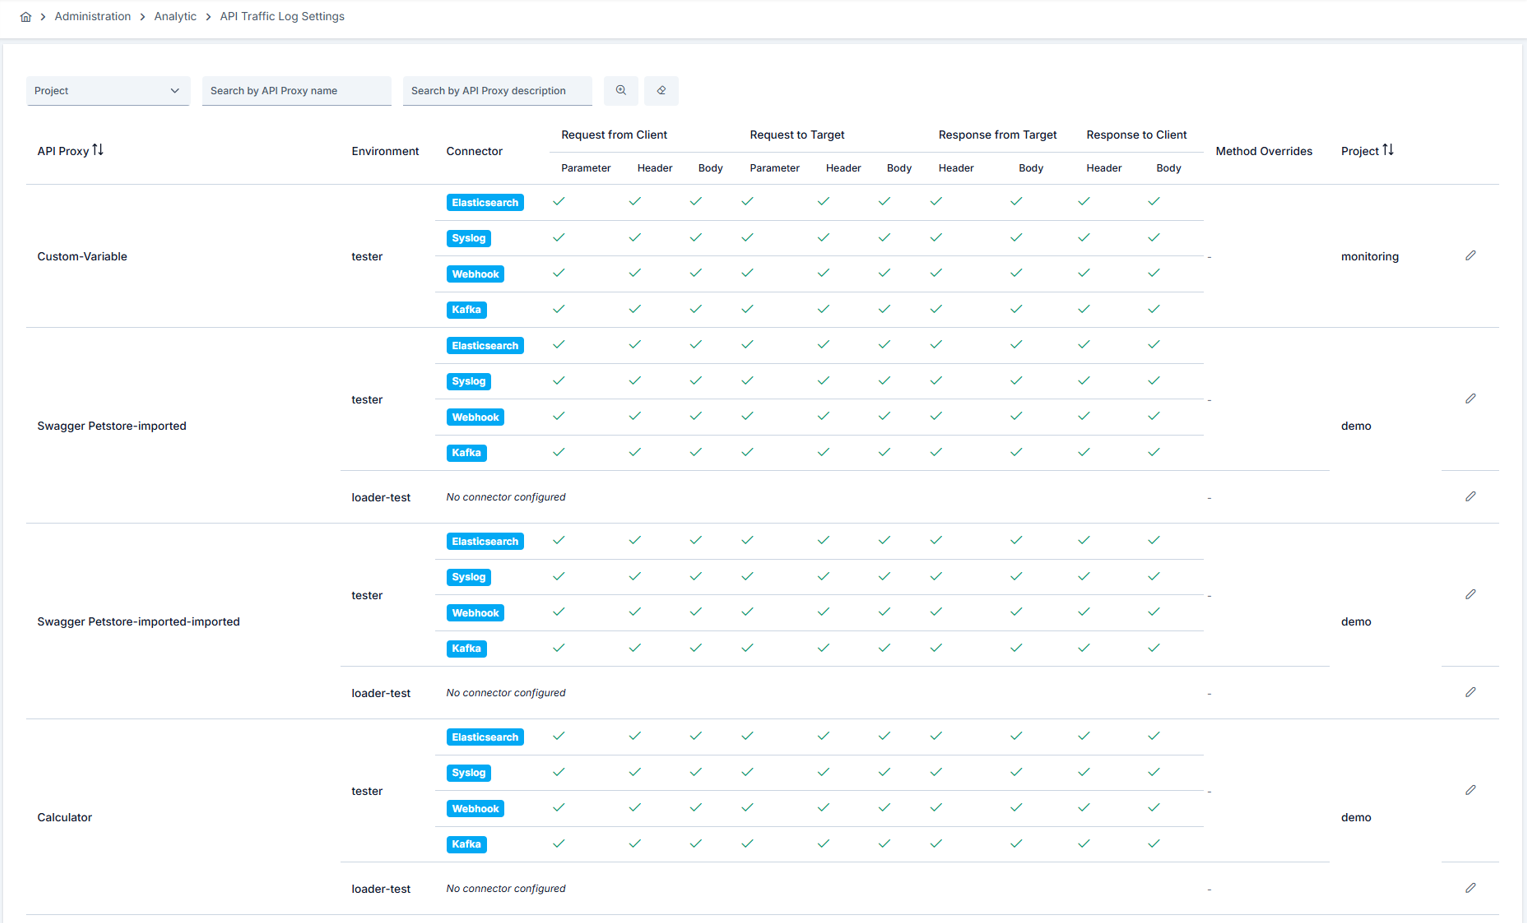
On this screen you can manage API Proxy-based traffic log settings. When connectors are defined on the environment, you can control whether each proxy sends traffic records to those targets.
Edit dialog (Edit API Traffic Proxy Log Settings)
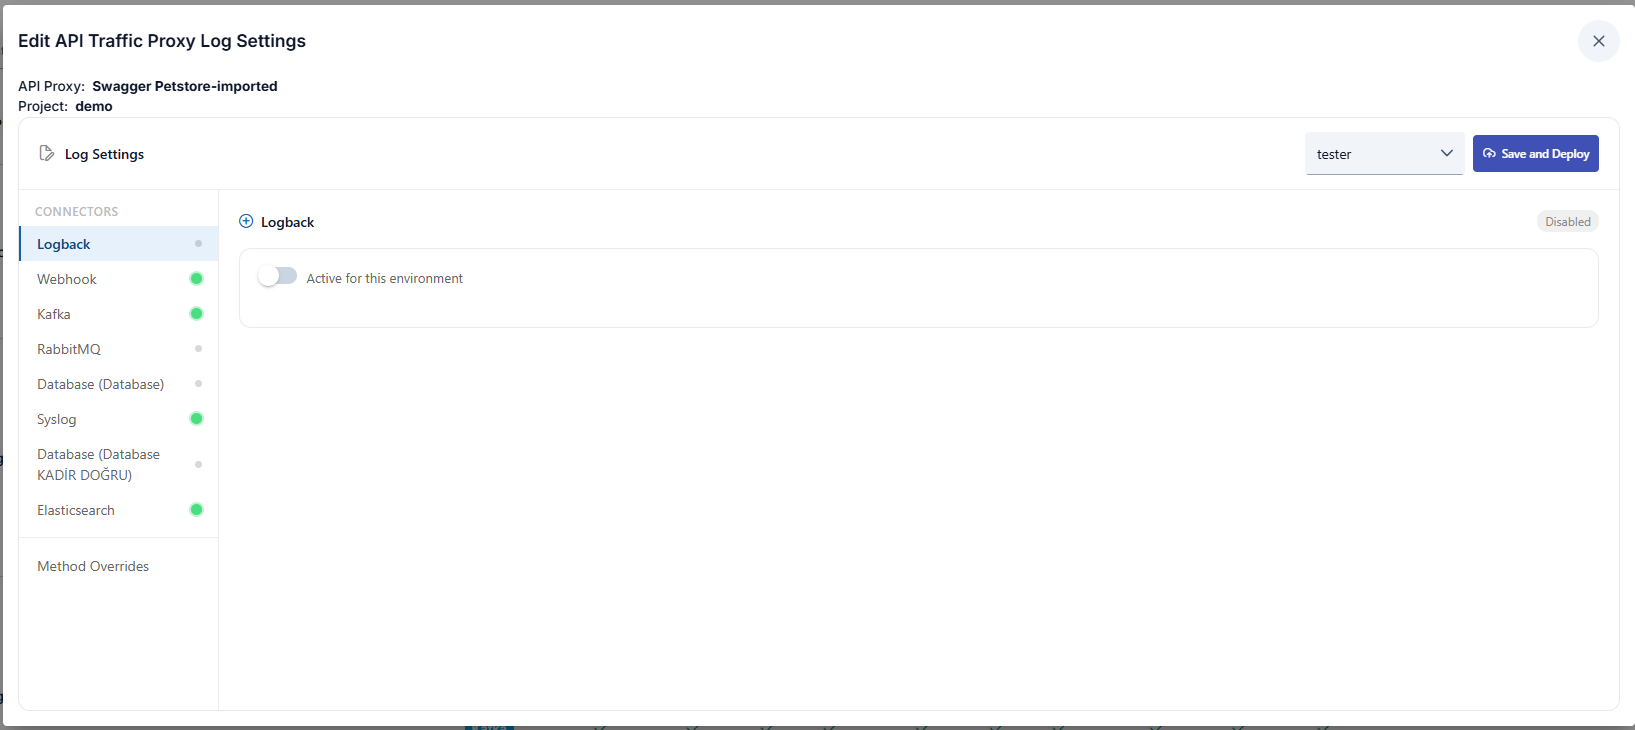
Opening Edit on a row shows a dialog with a CONNECTORS menu on the left (Logback, Webhook, Kafka, RabbitMQ, database, Syslog, Elasticsearch, and so on). Selecting an item loads that target’s configuration on the right. At the top you choose the environment and use Save and Deploy; on each connector card, Active for this environment turns sending on or off for the selected environment. The colored status dot next to a connector reflects its configuration state at a glance. Use Method Overrides for method-level overrides.
In Method Overrides, methods are listed with the HTTP verb in front of the path, for example GET /pet/{petId}, so endpoints that share a path but differ by verb can be told apart. Methods that have no HTTP verb, such as SOAP operations, are listed by name only.
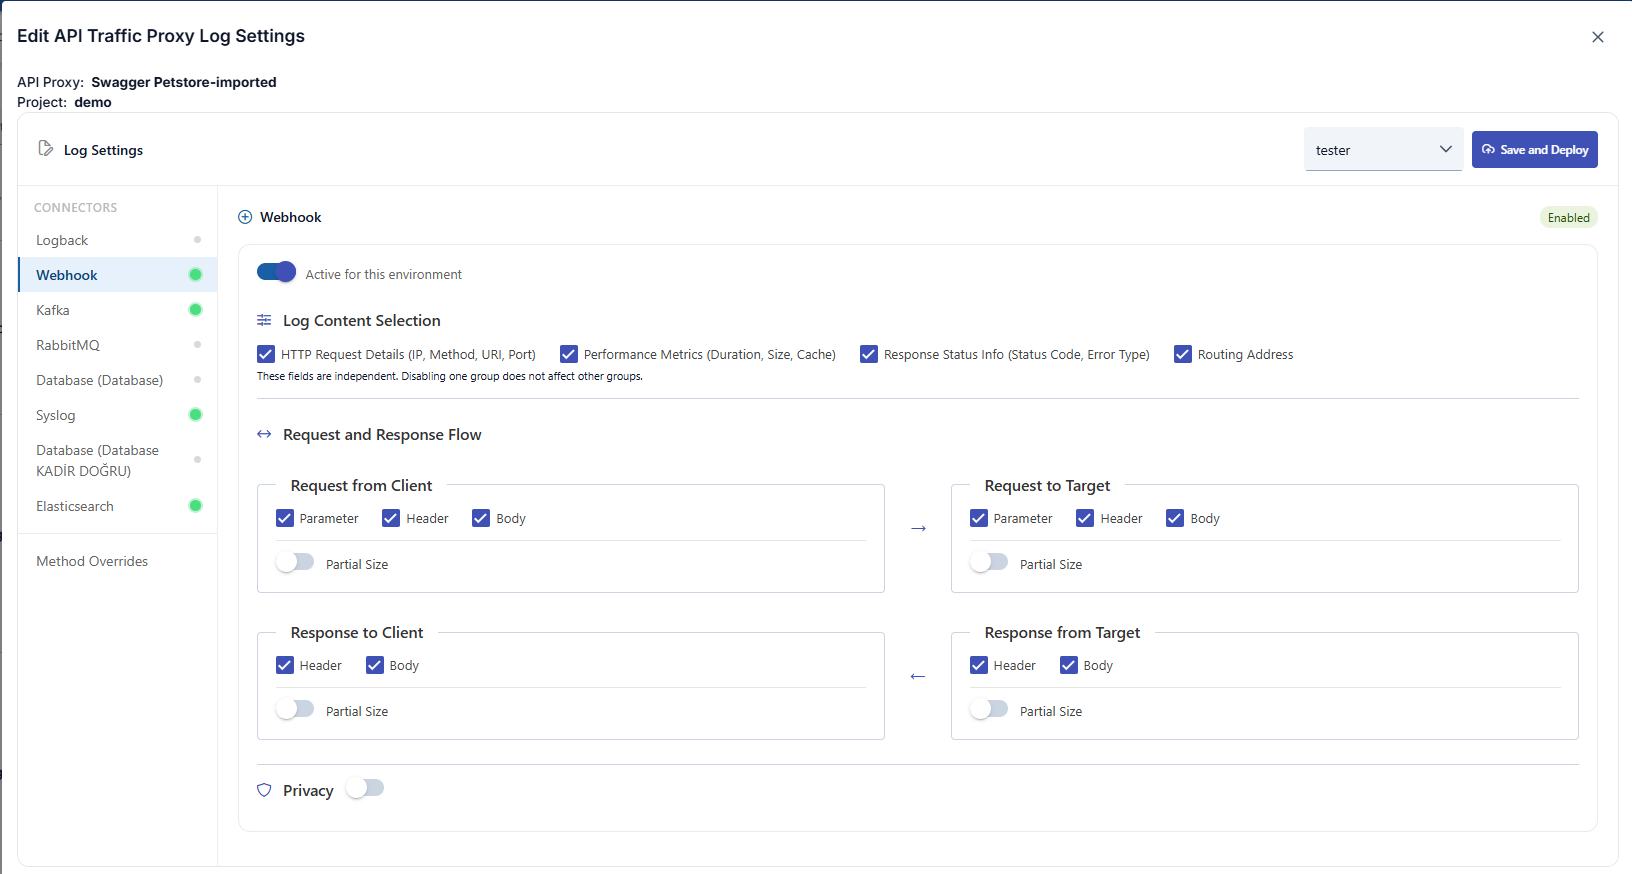
For the selected connector, the Log content section lets you toggle high-level groups such as HTTP request details, performance metrics, response status, and routing address; these groups are independent. In Request from Client, Request to Target, Response from Target, and Response to Client, you configure Parameter, Header, and Body (and Partial size where available) per message region. At the bottom, Privacy toggles privacy processing for this flow.
When a database connector is selected as the log target, the log tables’ schema prefix or custom table name is configured in the connection definition. For details, see the Database connection page.
Log Settings Fields
The main fields used in log settings are summarized below.
| Field | Description |
|---|---|
| Active for this environment | Turns sending traffic logs to this log target on or off for the selected environment. |
| HTTP request details | Controls inclusion of client IP, HTTP method, URI, port, and related request metadata in the log. |
| Performance metrics | Controls whether duration, message size, cache-related metrics, and similar values are written to the log. |
| Response status info | Controls inclusion of HTTP status code, error type, and related fields in the log. |
| Routing address | Controls whether routing or destination address information is written to the log. |
| Header | For each message region, controls whether header information is logged. |
| Body | For each message region, controls whether body content is logged. |
| Parameter | For each message region, controls whether parameter information is logged. |
| Partial size | For each message region, controls whether long text fields are truncated or size-limited when logged. |
| Policy execution times | Adds the order, type and duration (in milliseconds) of every policy that ran on the request. Off by default; see below. |
| Privacy | Controls whether environment-level privacy rules apply to log data sent through this connector. |
When HTTP request details is off, the caller's username and the caller's attribution are removed from the traffic log of that connector: the typed client attribution ids (ack, cot, coi, coo) and the subscription ids (subi, subp, subpl, subo). The AI tenant credential (aivk) is still written. Usage reports and AI alarms that count by these ids do not see that connector's traffic; quota and limit enforcement is not affected.
Policy Execution Times
When a request is slower than expected, the usual next question is which policy consumed the time. Answering it used to require enabling Trace on the API Proxy, which records the full before/after body, headers and parameters of every policy — too heavy to leave on in production.
Policy execution times answers the same question without capturing any payload. When the option is enabled, each traffic log record carries a compact list of the policies that ran on that request:
| Value | Meaning |
|---|---|
| Order | Execution order. The value also encodes the pipeline region: 0-9999 request, 10000-19999 response, 20000 and above error. The API Traffic detail screen shows the region and the position within it. |
| Policy type | The policy type, for example jwt-auth or content-filter. The policy name is deliberately not stored — it is usually an auto-generated identifier and carries no meaning on screen. |
| Duration | How long the policy took, in milliseconds. |
Records that come from the end of a streaming response, policies skipped because their condition was not met, and a truncation marker (when a request runs an unusually large number of policies) are shown with a small badge next to the policy type.
The measurement itself is not new work: the gateway already computes each policy's duration on every request and discards it when Trace is off. Enabling this option only keeps the value.
Turning it on
The option lives with the other log content flags and is set per log target, so you can write the timings to Elasticsearch while leaving them out of a relational database target. Method-level overrides apply as well.
Redeploy the API Proxy after changing it — traffic log settings reach the gateway with the proxy deployment.
Where the data is written
| Target | Representation |
|---|---|
| Elasticsearch | The pxt field, as a nested object array. nested keeps the type and the duration correlated, so a query such as "requests where policy X took longer than 100 ms" returns the right rows. |
| MongoDB | A sub-document array. |
| Relational database (SQL/JDBC) | The policy_exec_times column, as a single capped CSV: order:type:duration, pipe-separated. |
| Graylog | The same CSV as the relational target. |
The option is off by default. On the Elasticsearch side a nested field indexes every list item as a
separate internal document, so a record with 10-20 policies increases the document count of that index
accordingly. Enable it on the targets where you actually need the data.
The new field is added to the index template and the index is rolled over automatically during the upgrade. Because traffic logs are written to a data stream, the field is only available on backing indices created after the rollover; older records stay as they are.
If you write traffic logs to a relational database, the policy_exec_times column must be added once
per environment database. See the 2026.09.1 — Log Table ALTER Scripts
page; new installations already have the column via the
Apinizer Log Table Creation Commands
script.