Client Traffic & Time Metrics
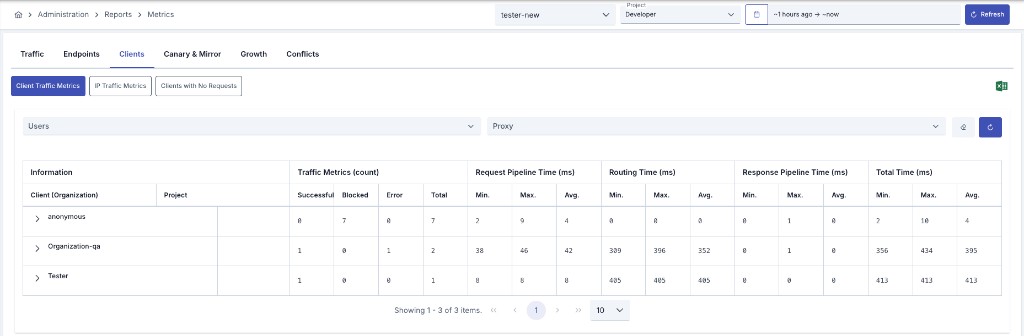
Since an API Proxy can be loaded into multiple environments, metrics must also be evaluated according to the environment it is loaded into. Therefore, in all analytics screens, metrics are filtered by first selecting environment information.
Metric data cannot be displayed for environments where Elasticsearch integration is not configured. In this case, a warning message is displayed on the screen.
Requests sent without a username/key that can be resolved during authentication are logged as anonymous and are grouped into a single anonymous row in the report. (If a policy — for example rate limiting — stops the request before the identity is resolved, the client is shown with whatever other identity that policy was able to resolve; anonymous is used only when no identity can be resolved at all.) Next to the username, if the client's credential record has an organization defined, that information is shown in parentheses (e.g. user1 (ACME Inc.)).
Metrics Page
This report is the Consumer Traffic tab of the Metrics page (full name: Client Traffic Metrics). Open it via Administration > Reports > Metrics or Reports > Metrics in the project menu.
Related tabs: IP Traffic, Inactive Consumers.
The table is a three-level tree; expand client rows to drill down to API Proxy and method/endpoint breakdown.
Filtering
The filter row at the top of the Metrics page is shared across all tabs and sub-reports:
| Option | Description |
|---|---|
| Environment | Select the environment whose metrics you want to view |
| Project | (Administration only) Filter metrics by selecting multiple projects |
| Date Range | Time range for metric calculation (default: last 1 hour) |
| Refresh | Re-queries the currently displayed sub-report |
| Excel Export | Export on the shared filter row; downloads the list for the active sub-report |
The sub-report row includes Choose Your Refresh Time (default: Manual) and a refresh button.
Table Column Descriptions
The table is a three-level tree table whose rows are organized by client; the columns are grouped into six sections.
Information
| Column | Description |
|---|---|
| Client (Organization) | The name of the row in the tree structure; its value changes depending on the row's level (see "Expanding Rows" below) |
| Project | (Only in the Admin menu) Name of the project the row belongs to — only populated for API Proxy-level rows, blank for client and method/endpoint rows |
Traffic Metrics (count)
The number of requests for this row in the selected environment and date range, broken down by result:
| Column | Description |
|---|---|
| Successful | Number of requests that completed successfully |
| Blocked | Number of requests blocked by policies (e.g. security, rate limiting) |
| Error | Number of requests that resulted in an error |
| Total | Successful + Blocked + Error request count |
Request Pipeline Time (ms)
The processing time of the request policies the request passes through after reaching the gateway and before being routed to the backend:
| Column | Description |
|---|---|
| Min. | Shortest time measured in this region (ms) |
| Max. | Longest time measured in this region (ms) |
| Avg. | Average time measured in this region (ms) |
Routing Time (ms)
The time elapsed while the request is sent to the backend and the response is received back (backend round-trip time):
| Column | Description |
|---|---|
| Min. | Shortest time measured in this region (ms) |
| Max. | Longest time measured in this region (ms) |
| Avg. | Average time measured in this region (ms) |
Response Pipeline Time (ms)
The processing time of the response policies the response coming back from the backend passes through before being delivered to the client:
| Column | Description |
|---|---|
| Min. | Shortest time measured in this region (ms) |
| Max. | Longest time measured in this region (ms) |
| Avg. | Average time measured in this region (ms) |
Total Time (ms)
The sum of Request Pipeline + Routing + Response Pipeline times; the total time elapsed from the request reaching the gateway to the response returning to the client:
| Column | Description |
|---|---|
| Min. | Shortest total time measured for this row (ms) |
| Max. | Longest total time measured for this row (ms) |
| Avg. | Average total time measured for this row (ms) |
Expanding Rows: Client → API Proxy → Method/Endpoint
Clicking the arrow icon on the left of a row drills down into the next level. The table has three levels:
- Client row (level 1): The top-level rows represent each client (username/identity, with the organization if resolvable) that sent requests in the selected environment and date range. Column values are the metrics aggregated across all API Proxies and methods called by that client.
- API Proxy row (level 2): When a client row is expanded, each API Proxy called by that client is listed as a separate child row. Column values are the metrics for only that API Proxy for that client. The Project column is populated only at this level.
- Method/Endpoint row (level 3): When an API Proxy row is expanded, each method/endpoint called by that client under that API Proxy is listed as a separate child row. Column values are the metrics for only that method/endpoint for that client.