Elasticsearch Monitor
Click the Refresh button to refresh information belonging to the selected working environment.
Overview, Nodes, Indices, Thread Pools, and Cluster Diagnostics information is found in the relevant tab.
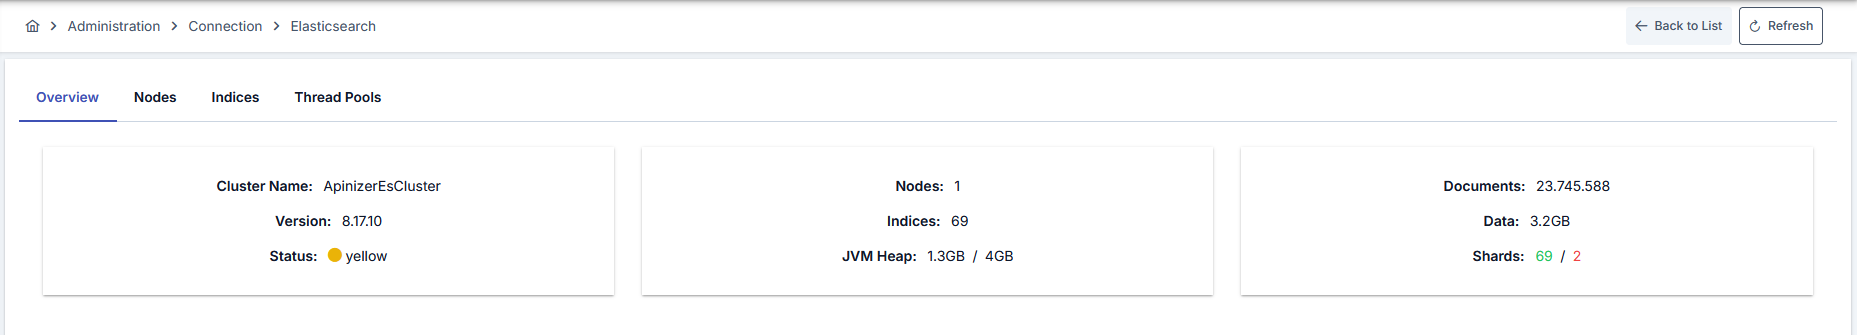
Overview
The image containing the Overview tab is shown below:
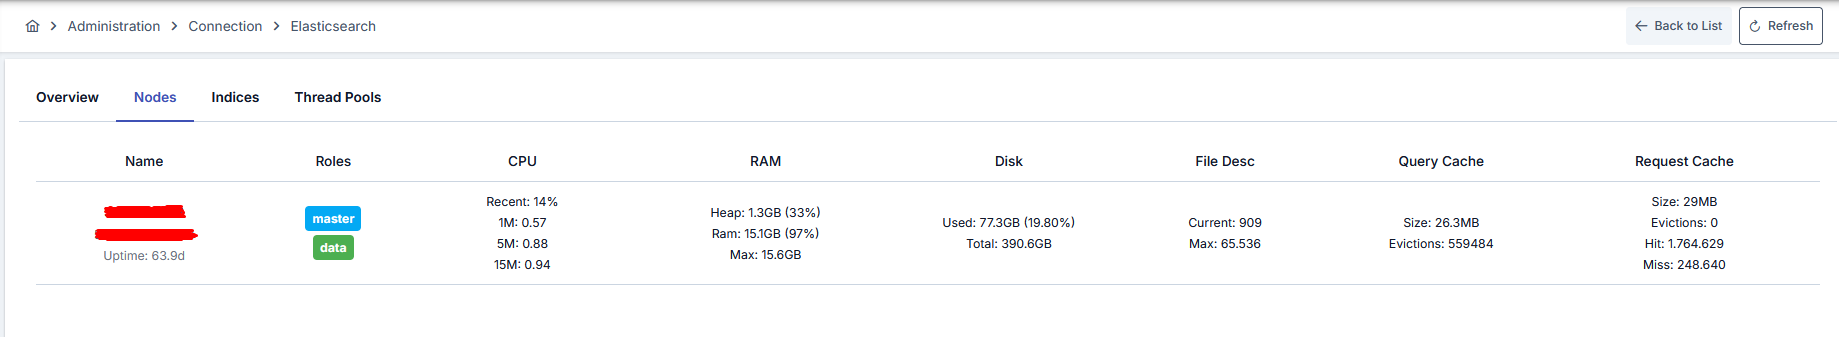
The image containing the Nodes tab is shown below:
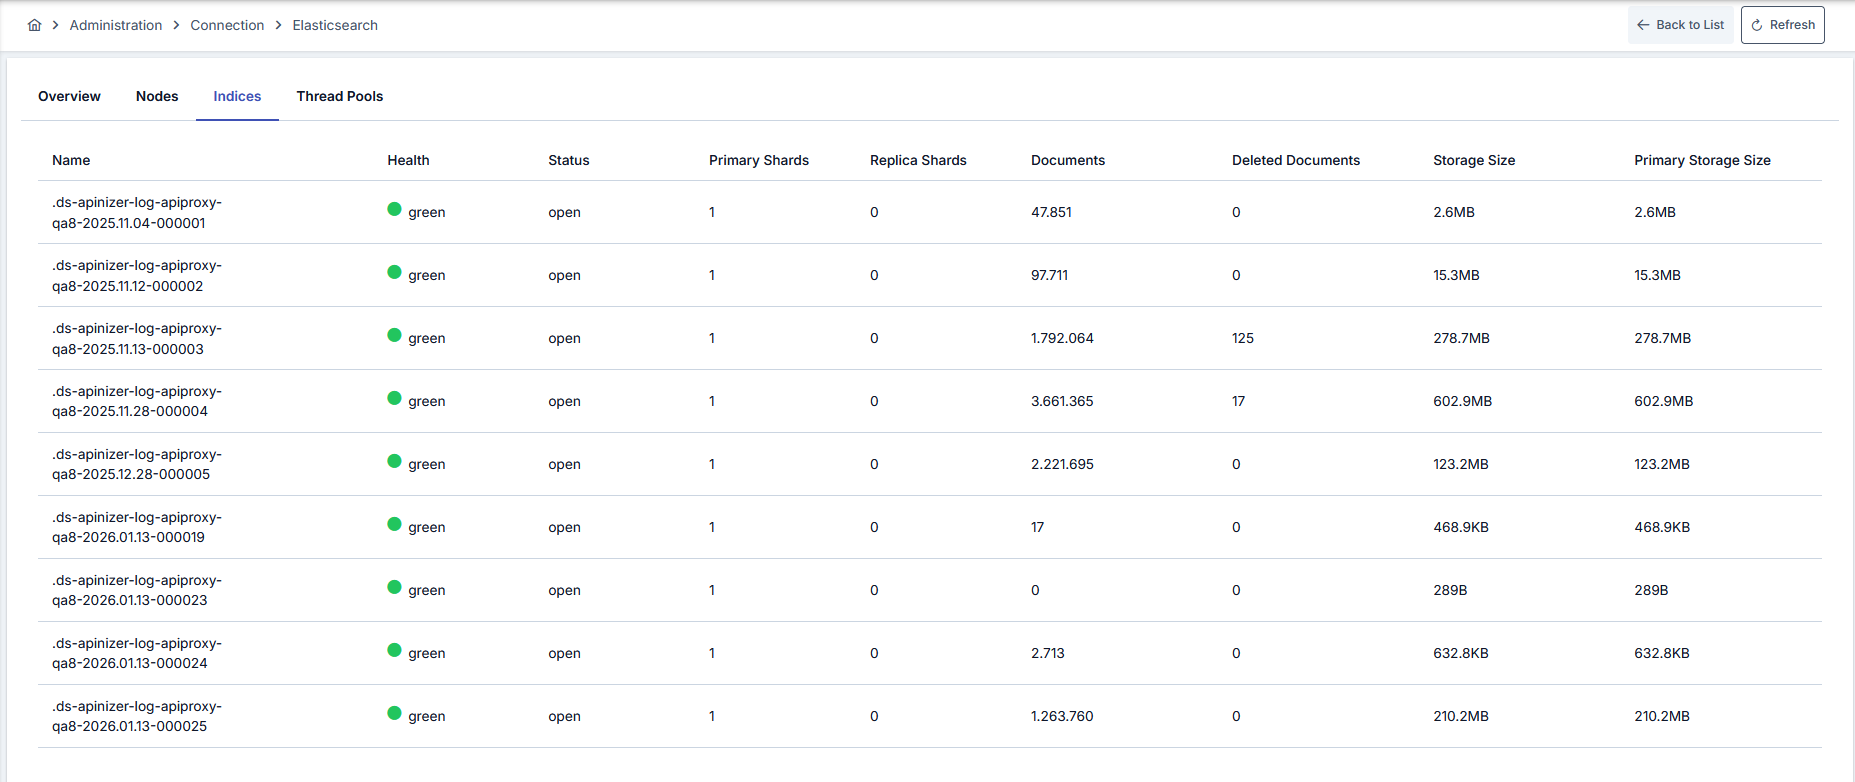
The image containing the Indices tab is shown below:
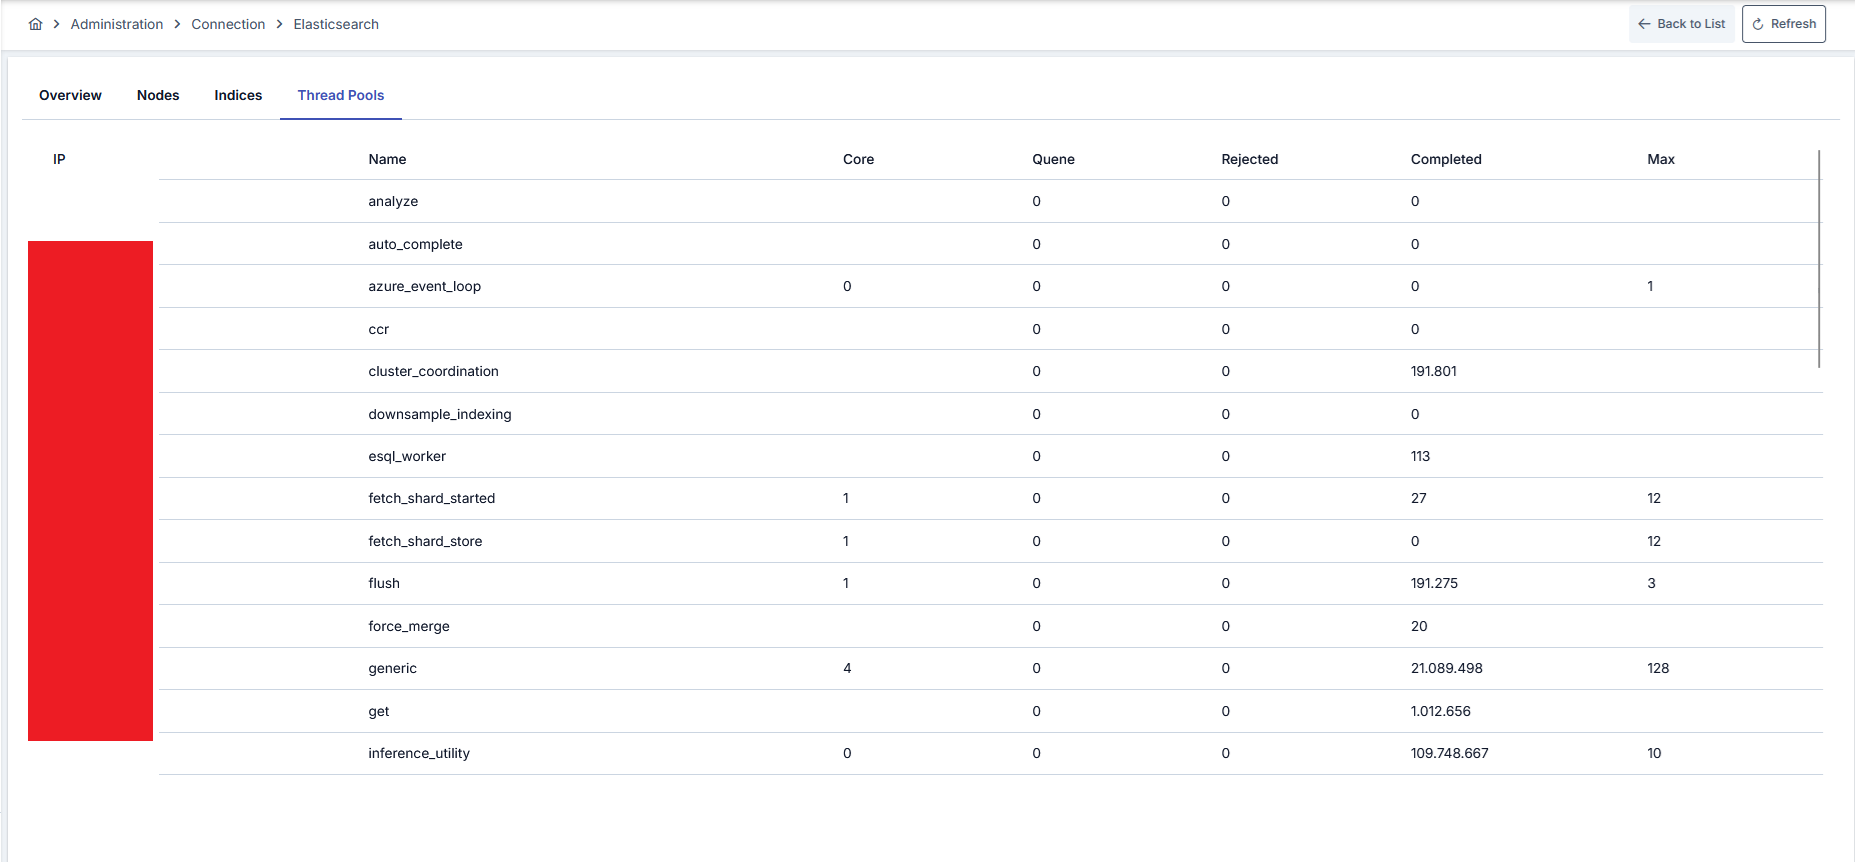
The image containing the Thread Pools tab is shown below:
Cluster Diagnostics
Provides raw diagnostic output for inspecting the operational state of your Elasticsearch cluster in depth. Brings troubleshooting, performance analysis, and configuration auditing under a single screen.
You can copy the contents of each panel to your clipboard as formatted JSON by clicking the copy icon next to the panel header. Output is automatically rendered in a readable layout; long output can be scrolled vertically inside the panel.
Cluster Health
Shows the overall health status of the cluster (green / yellow / red), the number of active shards, unassigned and delayed shards, the number of pending tasks, and the number of data nodes in a single place. This is the first panel to check in production.
Cluster Settings
Lists configuration settings that have been overridden on the cluster, either transiently or persistently. Useful for spotting settings that deviate from default behavior and detecting unknown overrides.
Shards
Shows the shard distribution of every index in detail: which node a shard resides on, whether it is primary or replica, its current state (started, unassigned, etc.), and the reason for being unassigned, if any.
ILM Policy
Shows the full definition of the Index Lifecycle Management policy configured for the connection. Phase rules (hot, warm, cold, delete), threshold values, and the indices that use this policy are displayed. If no policy is configured for the connection, the panel shows an "ILM policy is not configured" message.
Pending Tasks
Lists management operations that are queued in the cluster and not yet completed. Useful for quickly identifying which administrative operation is causing a bottleneck during heavy load.
Allocation Explain
Provides a detailed explanation of why a shard cannot be allocated. This is the most critical diagnostic source when cluster health turns yellow or red. If there are no unassigned shards, the panel may be empty or contain an informative error message.
Index Templates
Shows the templates Apinizer defines for traffic and application log indices (field mappings, settings, alias rules) in a single place. Used for validating unexpected mapping behavior and confirming template updates.
Active Recovery
Shows shard recovery operations currently in progress. Useful for tracking progress after a node restart, replica increase, or snapshot restore. The panel is empty when no recovery is in progress.