Alarm
Overview
Monitor pod and node health statuses
Track cluster health and resource usage
Monitor CPU and disk usage rates
Track SSL and JWK certificate durations
Monitor application log counts
Receive instant notifications when threshold values are exceeded
What is Alarm?
Basic Concept
Alarm is a monitoring system that continuously checks specific conditions in your system and sends notifications when these conditions are met.
When to Use?
Monitoring pod, node, and Elasticsearch health statuses
Tracking CPU and disk usage rates
Tracking SSL and JWK certificate durations
Monitoring application log counts
Receiving warnings before problems occur
Receiving automatic notifications in critical situations
How Does It Work?
Trigger type, threshold value, scheduling, and notifications are determined
Automatic checks are performed at specified times (e.g., every hour)
A specific metric or status is checked according to the trigger type
If there is a threshold value, it is checked whether the checked value exceeded the threshold value
When the threshold is exceeded or status changes, configured notifications are triggered
All checks are recorded in history
Quick Start
Creating Your First Alarm
Click Main Menu → Monitoring → Alarm
Click the "Create New" button
- Name: A name for the alarm (e.g., "Elasticsearch CPU Monitoring")
- Description: Optional description
Select the trigger type (e.g., Elasticsearch CPU Percentage)
Enter the threshold value (e.g., 80)
Determine the check frequency (e.g., Every hour)
Click the "Save" button
Creating New Alarm
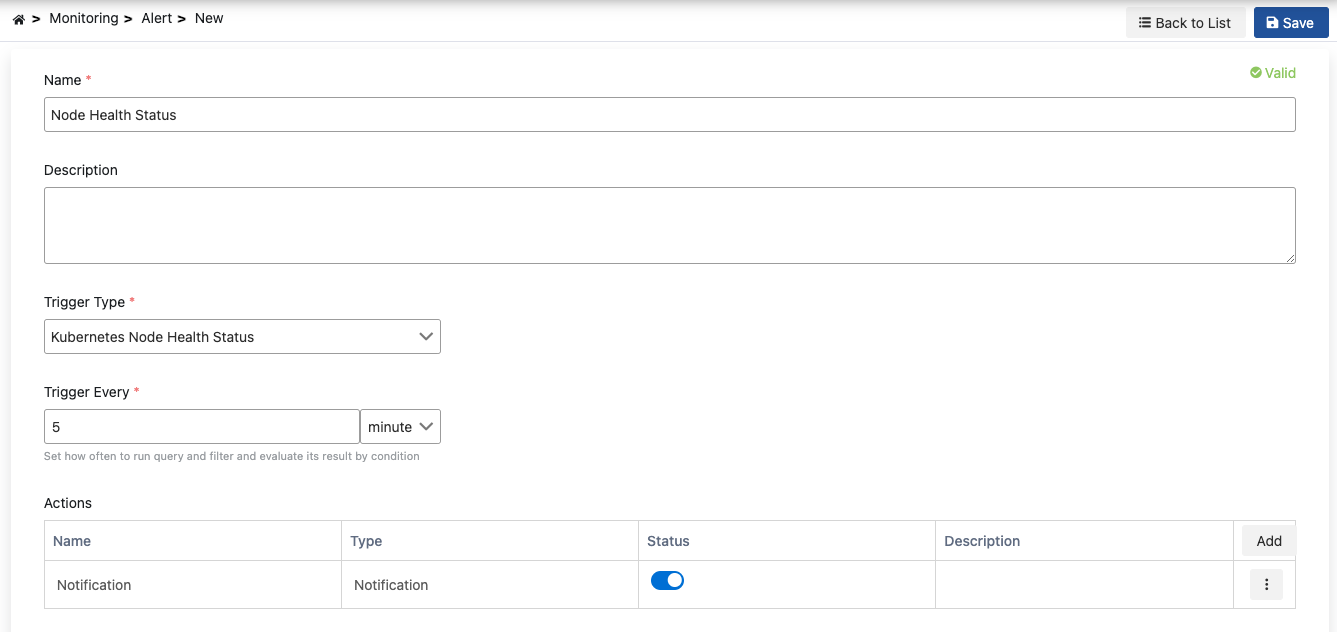
Step 1: Basic Information
Name - Required
Enter a unique name for the alarm. This name:
- Must be unique within the project
- Cannot start with a space
- The system automatically checks the availability of the name
Good Name Examples:
Elasticsearch CPU MonitoringKubernetes Pod Health StatusSSL Certificate Duration TrackingApplication Log Count Monitoring
Description - Optional
You can enter descriptive information about the alarm:
- Maximum 1000 characters
- Used to explain the purpose and scope of the alarm
- Displayed on the list page
Example Descriptions:
Created to monitor CPU usage of Elasticsearch clusterUsed to track health status of Kubernetes podsConfigured to warn before SSL certificates expire
Status - Default: Active
Determines the active/passive status of the alarm:
- Active: Alarm runs, scheduled checks are performed
- Passive: Alarm is stopped, no checks are performed (historical data is preserved)
Step 2: Trigger Type and Threshold Value
Trigger Types
Determines when the alarm will be triggered. Select one of the following trigger types:
- Pod Health Status
- Node Health Status
- K8S Node CPU Percentage
- Health Status
- CPU Percentage
- Disk Percentage
- Logs in Database
- SSL Certificate Remaining Duration
- JWK Certificate Remaining Duration
- Application Log Count
Kubernetes Trigger Types
Pod Health Status: Checks the health status of Kubernetes pods. Alarm is triggered when any pod becomes unhealthy. Does not require threshold value.
Node Health Status: Checks the health status of Kubernetes nodes. Alarm is triggered when any node becomes unhealthy. Does not require threshold value.
K8S Node CPU Percentage: Checks the CPU usage percentage of Kubernetes nodes. Alarm is triggered when CPU usage percentage exceeds the threshold value. Requires threshold value (e.g., 80 = 80%).
Elasticsearch Trigger Types
Elasticsearch Health Status: Checks the health status of Elasticsearch cluster. Alarm is triggered when cluster becomes unhealthy. Does not require threshold value. Requires connection definition.
Elasticsearch CPU Percentage: Checks the CPU usage percentage of Elasticsearch cluster. Alarm is triggered when CPU usage percentage exceeds the threshold value. Requires threshold value (e.g., 80 = 80%). Requires connection definition.
Elasticsearch Disk Percentage: Checks the disk usage percentage of Elasticsearch cluster. Alarm is triggered when disk usage percentage exceeds the threshold value. Requires threshold value (e.g., 90 = 90%). Requires connection definition.
Elasticsearch Logs in Database: Checks whether Elasticsearch logs are in the database. Alarm is triggered when logs are in the database. Does not require threshold value.
Certificate Trigger Types
SSL Certificate Remaining Duration: Checks the remaining duration of SSL certificates. Alarm is triggered when remaining duration is less than the threshold value. Requires threshold value (e.g., 30 = 30 days).
JWK Certificate Remaining Duration: Checks the remaining duration of JWK certificates. Alarm is triggered when remaining duration is less than the threshold value. Requires threshold value (e.g., 30 = 30 days).
Application Log Trigger Types
Application Log Count: Checks the count of a specific application log type. Alarm is triggered when log count exceeds the threshold value. Requires threshold value (e.g., 10000 = 10,000 records). Log type must be selected.
Supported Log Types:
- Manager Logs
- Gateway Logs
- Cache Logs
- Integration Logs
- Portal Logs
- Audit Logs Manager
- Audit Logs ACL
- And more...
Threshold Value
Threshold value determines when the alarm will be triggered. Different units are used according to the trigger type:
| Trigger Type | Unit | Example Value | Description |
|---|---|---|---|
| K8S Node CPU Percentage | % | 80 | When CPU usage exceeds 80% |
| Elasticsearch CPU Percentage | % | 80 | When CPU usage exceeds 80% |
| Elasticsearch Disk Percentage | % | 90 | When disk usage exceeds 90% |
| SSL Certificate Remaining Duration | Days | 30 | When remaining duration is less than 30 days |
| JWK Certificate Remaining Duration | Days | 30 | When remaining duration is less than 30 days |
| Application Log Count | Records | 10000 | When log count exceeds 10,000 |
Threshold Value Recommendations:
- CPU Monitoring: Between 70-80%
- Disk Monitoring: Between 80-90%
- Certificate Tracking: Between 30-60 days
- Log Count: According to system capacity
Connection Definition
Some trigger types require Elasticsearch connection:
Trigger Types Requiring Connection:
- Elasticsearch Health Status
- Elasticsearch CPU Percentage
- Elasticsearch Disk Percentage
Trigger Types Not Requiring Connection:
- Kubernetes trigger types
- Certificate trigger types
- Application log trigger types
Elasticsearch connection is selected from connections created on the Connection Management page. Connection must be active and accessible.
Step 3: Scheduling Settings
Determine how frequently the alarm will be checked. Scheduling is done using Cron Expression.
Common Scheduling Examples
| Description | Cron Expression | Use Case |
|---|---|---|
| Every hour | 0 0 * ? * * | For general monitoring (most common) |
| Every 30 minutes | 0 */30 * ? * * | For critical systems |
| Every 15 minutes | 0 */15 * ? * * | For very critical systems |
| Every day at 09:00 | 0 0 9 * ? * | For daily reporting |
| Every 5 minutes | 0 */5 * ? * * | For situations requiring very frequent checks |
Recommendations:
- General Monitoring: Every hour
- Critical Systems: Every 15-30 minutes
- Certificate Tracking: Every day at 09:00
- Resource Monitoring: Every 30 minutes
Step 4: Notification Recipients
Configure recipients who will receive notifications when the alarm is triggered:
Adding Notifications
Click the "Add" button in the Actions table
Supported notification types:
- Email: Sends email notification
- Webhook: Sends HTTP POST request
- Slack: Sends message to Slack channel
- SMS: Sends SMS notification
- System Notification: Sends in-system notification
- And more...
Fill in the required information according to the notification type
For detailed information about actions, see the Connectors page.
Notification Management
Notification Table Columns:
- Name: Notification name
- Type: Notification type (Email, Webhook, Slack, etc.)
- Status: Active/Passive status
- Description: Notification description
Notification Operations:
- Edit: Select "Edit" from the menu to update notification information
- Delete: Select "Delete" from the menu to remove the notification
- Active/Passive: You can activate/deactivate the notification with toggle
Step 5: Saving
After filling in all information:
-
Make sure form validations pass:
- ✅ Name entered and available
- ✅ Trigger type selected
- ✅ Threshold value entered (if required)
- ✅ Connection definition selected (if required)
- ✅ Scheduling settings configured
-
Click the "Save" button
-
After the alarm is saved, you will be automatically redirected to the listing page
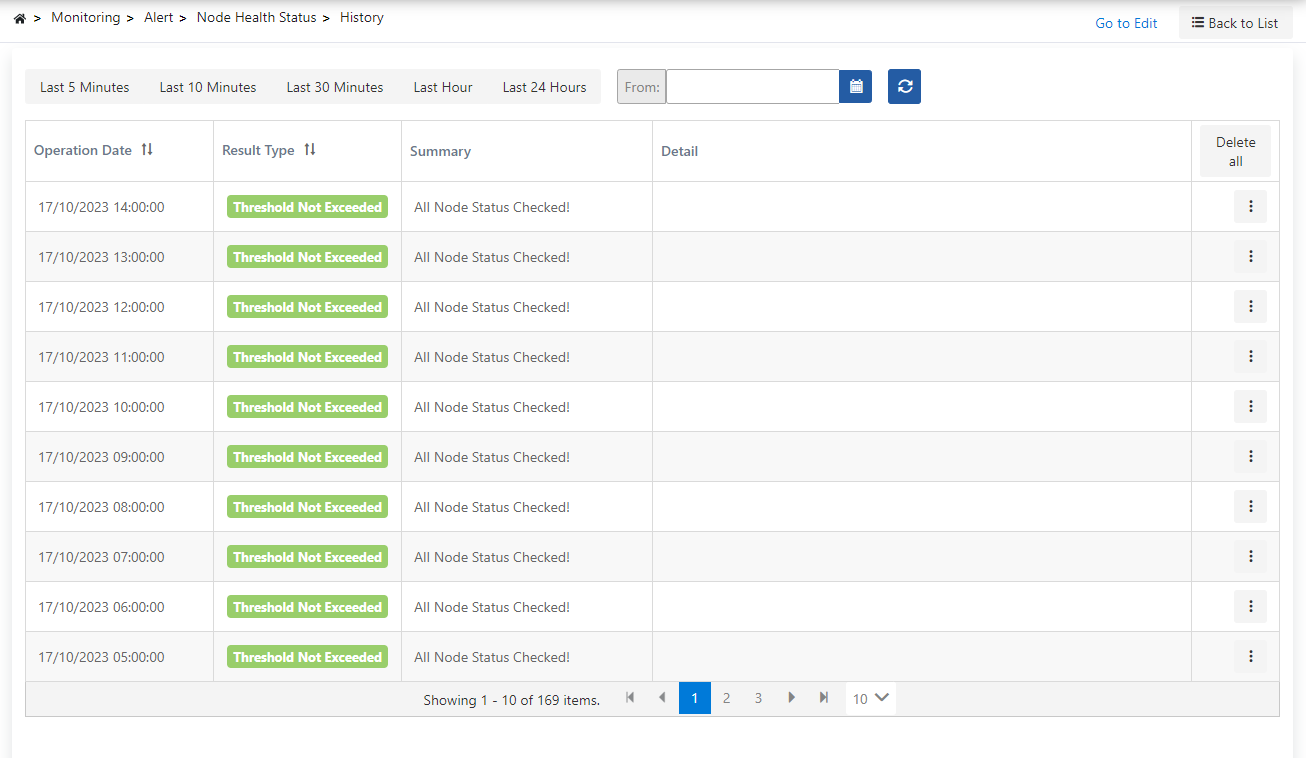
Monitoring and Reporting Results
Accessing History Page
- Click on the alarm name in the alarm list OR
- Select "Results" option from the operations menu (⋮)
History Page Sections
1. History Table
Table showing detailed results of each check run:
Columns:
- Operation Date: Date and time when the check was performed
- Result Type: Check result:
- 🟢 Threshold Not Exceeded (THRESHOLD_NOT_EXCEEDED): Threshold value not exceeded (normal)
- 🔴 Threshold Exceeded (THRESHOLD_EXCEEDED): Threshold value exceeded (alarm triggered)
- 🟠 Error Occurred (AN_ERROR_OCCURRED): Error occurred during check
- Operations: Menu button (⋮)
2. Viewing Result Details
- Click the menu button (⋮) in the table
- Select one of the following options:
- Detail: View result details
- Delete: Delete the result
Detail Dialog:
- Summary: Summary of the check result
- Detail: Detailed information about the check result
3. Header Section
- Date Range Selector: Filter history records by a specific date range
- Refresh Button: Manually refresh history
- Delete All Button: Delete all history records
- Alarm Information: Alarm name and description
Alarm Management
List Page Features
On the alarm list page, you can view and manage all your alarms.
Search and Filtering
- Search by Name: Filter alarms by typing in the name field
- Search by Description: Search by typing in the description field
- Trigger Type Filter: Filter by trigger type
- Status Filter: Filter by Active/Passive status
- Clear: Click the eraser icon to clear all filters
Table Columns
- Name: Alarm name (clickable, goes to history page)
- Description: Alarm description
- Trigger Type: Alarm trigger type
- Threshold: Threshold value and unit (if any)
- Status: Active/Passive status (can be changed with toggle)
- Operations: Menu button (⋮)
Operations Menu
For each alarm, click the menu button (⋮) to perform the following operations:
- Results: View alarm history records
- Edit: Update alarm settings
- Delete: Delete the alarm
Changing Status
To change the active/passive status of the alarm:
- Click the toggle in the Status column in the table
- Alarm status is updated instantly
- Passive alarms do not run, but their historical data is preserved
Best Practices
- Use descriptive names:
Elasticsearch CPU Monitoring - Add environment/project prefix:
Production - SSL Certificate Tracking - Specify trigger type:
K8S Node CPU Monitoring
- CPU Monitoring: Between 70-80%
- Disk Monitoring: Between 80-90%
- Certificate Tracking: Between 30-60 days
- Log Count: According to system capacity
- Critical Systems: Every 15-30 minutes
- General Monitoring: Every hour
- Certificate Tracking: Every day at 09:00
- Resource Monitoring: Every 30 minutes
- Critical Alarms: Email + SMS notification
- General Alarms: Email notification is sufficient
- Webhook: Send notifications to your integration systems
- Notification Spam: Avoid notification spam with appropriate scheduling
Frequently Asked Questions
How Often Does Alarm Run?
The frequency of alarm execution depends on the Scheduling (Cron Expression) settings you determined when creating it. For example:
0 0 * ? * *→ Every hour0 */30 * ? * *→ Every 30 minutes0 0 9 * ? *→ Every day at 09:00
What Happens When Alarm is Deactivated?
When alarm is deactivated:
- No new checks are performed
- Existing scheduled jobs are cancelled
- History records are preserved and can be viewed
- Alarm continues normal operation when reactivated
How is Threshold Value Determined?
Threshold value should be determined according to your system's normal operating conditions:
- CPU Monitoring: 20-30% above normal CPU usage
- Disk Monitoring: 80-90% of disk capacity
- Certificate Tracking: Before certificate renewal time (e.g., 30 days)
- Log Count: According to system capacity
Can I Add Multiple Notifications?
Yes, you can add multiple notifications. Each notification:
- Can be a different type (Email, SMS, Webhook, etc.)
- Can be sent to different recipients
- Can be independently activated/deactivated
How Long Are History Records Kept?
History records are kept until manually deleted. To clean old records:
- You can use the "Delete All" button on the history page
- Or you can clean records regularly
What Happens When Alarm is Deleted?
When alarm is deleted:
- Alarm definition is deleted from database
- All history records are deleted
- Scheduled jobs are cancelled
- Historical data is permanently lost
Warning: Deletion cannot be undone!
Troubleshooting
Alarm Not Working
Possible Causes:
- Alarm may be in passive status → Check status toggle
- Scheduling settings may be wrong → Check cron expression
- Elasticsearch connection may not exist or be inaccessible → Check connection settings
- Threshold value may be incorrectly configured → Check threshold value
Solution:
- Activate alarm status
- Check scheduling settings
- Check Elasticsearch connection
- Check threshold value
All Results Are in 'Error Occurred' Status
Possible Causes:
- Elasticsearch connection does not exist or is inaccessible
- Kubernetes cluster is inaccessible
- System resources are insufficient
- Configuration error
Solution:
- Check Elasticsearch connection
- Check Kubernetes cluster connection
- Check system resources
- Check alarm configuration
Too Many Notifications Coming
Possible Causes:
- Threshold value is too low
- Scheduling is too frequent
- Multiple notifications are active
Solution:
- Increase threshold value
- Reduce scheduling frequency
- Deactivate unnecessary notifications
Notifications Not Coming
Possible Causes:
- Notification is in passive status
- Notification configuration is incorrect
- Email/SMS service is not working
Solution:
- Activate notification status
- Check notification configuration
- Check Email/SMS service settings