Report Generator
Report Types
When creating a Report Generator, you first select which dataset the report will be based on. The available fields in subsequent steps vary depending on the selected type.
| Report Type | Description |
|---|---|
| API Traffic Logs | A report is generated on raw traffic records by adding a custom query and filter to log data. |
| Interval API Traffic | API traffic is analyzed by grouping into specific time intervals (hourly, daily, etc.). |
| API Traffic Metrics | Metrics such as traffic volume and success/error rates are reported per API Proxy. |
| Endpoint Traffic Metrics | Traffic metrics are reported per endpoint. |
| Canary & Mirror Metrics | Traffic metrics for Canary and Mirror configurations are reported. |
| Endpoint Size Metrics | Metrics related to endpoint request and response sizes are reported. |
| Client Traffic Metrics | Traffic metrics are reported per client (credential). |
| IP Traffic Metrics | Traffic metrics are reported per IP address. |
| API Proxy Report | The general status and information of API Proxies are reported. |
| API Endpoint Report | The general status and information of API Endpoints are reported. |
| Inactive Endpoints | Endpoints that have not received requests within a specified period are listed. |
| Inactive Clients | Clients that have not sent requests within a specified period are listed. |
| ACL Report | Authorization statuses on the access control list (ACL) are reported. |
| Route Conflict Report | Conflicts between defined routes are detected and reported. |
| ACL Audit Records | Audit records of changes made to the ACL are reported. |
Report Creation
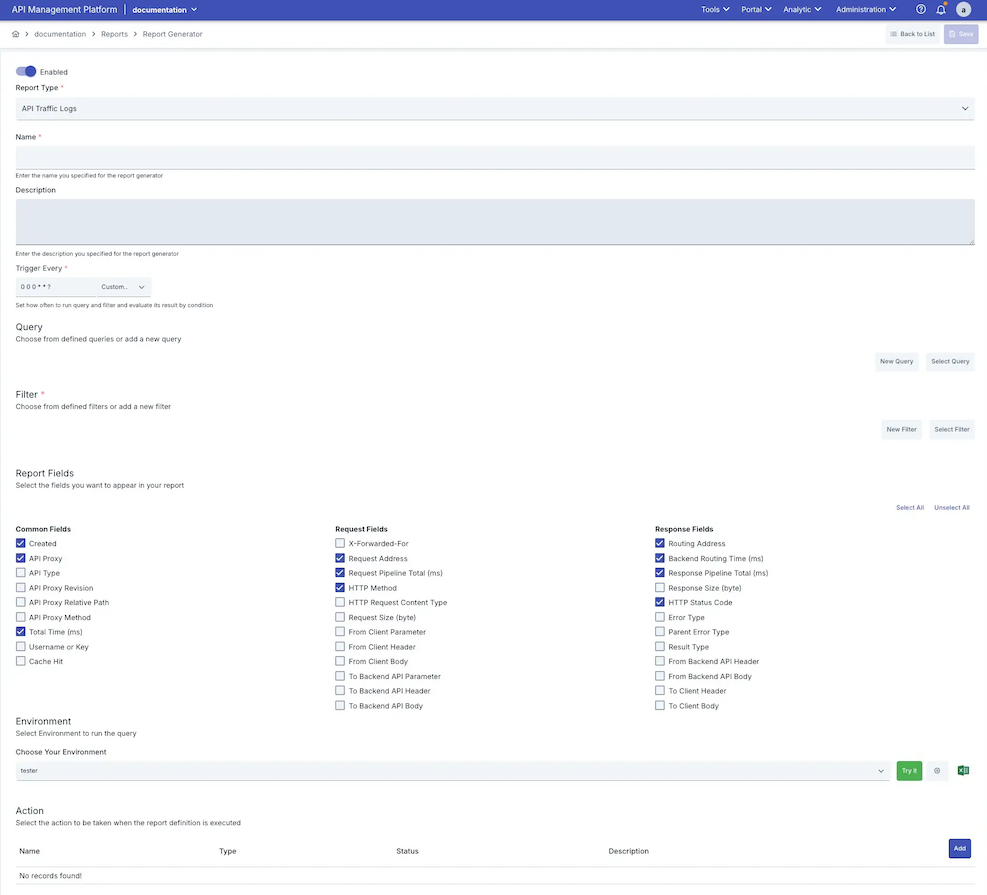
Definition
| Field | Description |
|---|---|
| Enabled | Determines whether the Report Generator is active. Reports in passive state are not run even if scheduled. |
| Report Type | Determines which dataset the report will be based on. Subsequent steps are shaped according to the selected type. |
| Name | The unique name given to the Report Generator. |
| Description | An optional description field summarizing the purpose of the Report Generator. |
| Trigger Every | Sets how often the report will be run automatically. Schedules such as per-minute, hourly, daily, and weekly can be defined using cron expression format. |
Query
This step is only visible for the API Traffic Logs report type.
An optional custom query can be added to narrow down raw log data. The query is used to select log records that meet certain conditions.
Two options are available:
- New Query — A new query can be created on the fly.
- Select Query — An existing previously defined query can be selected.
The selected query is displayed on screen and can be edited or removed.
Selecting a query is not mandatory. When no query is added, all log records matching the filter conditions are included in the report.
Filter
The filter determines which log records will be evaluated in the report. This step is required.
Two options are available:
- New Filter — A new filter can be created on the fly.
- Select Filter — An existing previously defined filter can be selected.
The following settings can be configured when creating a filter:
| Field | Description |
|---|---|
| Name | The name given to the filter. |
| Proxy List | Determines which API Proxies the report will run on. If not selected, all proxies are included. |
| Date Range | Determines which time period's log records the report will cover. A fixed anchor (e.g. "Today") or a dynamic range (e.g. "Last 7 days") can be selected. |
| Operation Result Type | A filter can be applied to include only successful, failed, or blocked requests. (Only applicable for the API Traffic Logs type.) |
| Sorting | Determines by which field and in which direction the report records will be sorted. (Only applicable for the API Traffic Logs type.) |
Report Fields
This step is only visible for the API Traffic Logs report type.
The log fields to appear in the report are selected in this section. Fields are grouped into three categories.
Select All and Unselect All buttons allow bulk operations.
- Common Fields
- Request Fields
- Response Fields
| Field | Description |
|---|---|
| Created | The date and time the request was created. |
| API Proxy | The name of the API Proxy the request passed through. |
| API Type | The type of the API (REST, SOAP, etc.). |
| API Proxy Revision | The API Proxy revision used. |
| API Proxy Relative Path | The relative path of the API Proxy. |
| API Proxy Method | The HTTP method used in the request (at proxy level). |
| Total Time (ms) | The total processing time of the request (in milliseconds). |
| Username or Key | The username or API key of the user who made the request. |
| Cache Hit | Whether the request was served from cache. |
| Field | Description |
|---|---|
| X-Forwarded-For | The header value carrying the client's real IP address. |
| Request Address | The full URL address of the request. |
| Request Pipeline Total (ms) | Total processing time in the request pipeline (in milliseconds). |
| HTTP Method | The HTTP method used in the request (GET, POST, etc.). |
| HTTP Request Content Type | The content type of the request body (Content-Type). |
| Request Size (byte) | The size of the request body (in bytes). |
| From Client Parameter | Query parameters coming from the client. |
| From Client Header | HTTP headers coming from the client. |
| From Client Body | The request body coming from the client. |
| To Backend API Parameter | Query parameters forwarded to the backend API. |
| To Backend API Header | HTTP headers forwarded to the backend API. |
| To Backend API Body | The request body forwarded to the backend API. |
| Field | Description |
|---|---|
| Routing Address | The backend address the request was routed to. |
| Backend Routing Time (ms) | The routing time to the backend (in milliseconds). |
| Response Pipeline Total (ms) | Total processing time in the response pipeline (in milliseconds). |
| Response Size (byte) | The size of the response body (in bytes). |
| HTTP Status Code | The HTTP status code returned by the backend. |
| Error Type | The error type if an error occurred. |
| Parent Error Type | The parent-level error type. |
| Result Type | The type of the operation result (successful, failed, etc.). |
| From Backend API Header | HTTP headers coming from the backend API. |
| From Backend API Body | The response body coming from the backend API. |
| To Client Header | HTTP headers forwarded to the client. |
| To Client Body | The response body forwarded to the client. |
Selecting only the required fields reduces report size and allows it to be generated faster.
Report Parameters
Additional parameters appear based on the selected report type. These parameters allow the scope of the report to be defined in more detail.
| Parameter | Relevant Report Types | Description |
|---|---|---|
| Projects | Multiple report types | Determines which projects the report will cover. (Only visible to Admin users.) |
| Interval | Interval API Traffic | The time interval by which traffic data will be grouped (minute, hour, day, etc.). |
| API Proxy Type | Various metric types | Allows filtering by specific proxy types. |
| Creation Type | Various metric types | Allows filtering by proxy creation method. |
| Organizations | ACL Report | Determines which organizations the report will cover. |
| Credentials | ACL Report | Determines which credentials the report will cover. |
| Query Basis | ACL Report | Determines whether the report will run on an API Proxy or organization basis. |
| API Proxy | API Traffic Metrics | Allows the report to run on a specific proxy only. |
Environment
The environment on which the report will run is selected in this step.
For Elasticsearch-based report types, environment selection is required. The selected environment must have an active Elasticsearch integration.
Trigger Every
The frequency at which the report will run automatically is set in this section. Scheduling settings are created in cron expression format.
Before scheduling, it is recommended to use the Try It feature to verify that the report produces correct results.
Action
Where the file generated when the report runs will be sent is defined in this section. One or more recipients can be added.
Supported action types include email and webhook. For detailed information about actions, see the Connectors page.
When the report file size exceeds the 25 MB limit, the action is not executed and a notification is shown to the user. In this case, it is recommended to narrow the date range.
Retention Period
How long result records from past report runs will be kept is set in this section. At the end of the specified period, old results are automatically cleaned up.
Testing the Report
An option is provided to test the report instantly with current settings before saving.
- API Traffic Logs
- Other Report Types
After the query and filter are defined, the query is run instantly on the selected environment using the Query button. Results are listed in a paginated table view on screen.
Only the first 10 records are shown in the preview. To see all results, you need to schedule and run the report.
Results can be exported as Excel, allowing the instant query output to be examined in more detail.
Data for the selected report type is fetched instantly and a table preview is shown using the Try It button.
Only the first 10 records are shown in the preview. To see all results, you need to schedule and run the report.
Preview results can be exported as Excel.
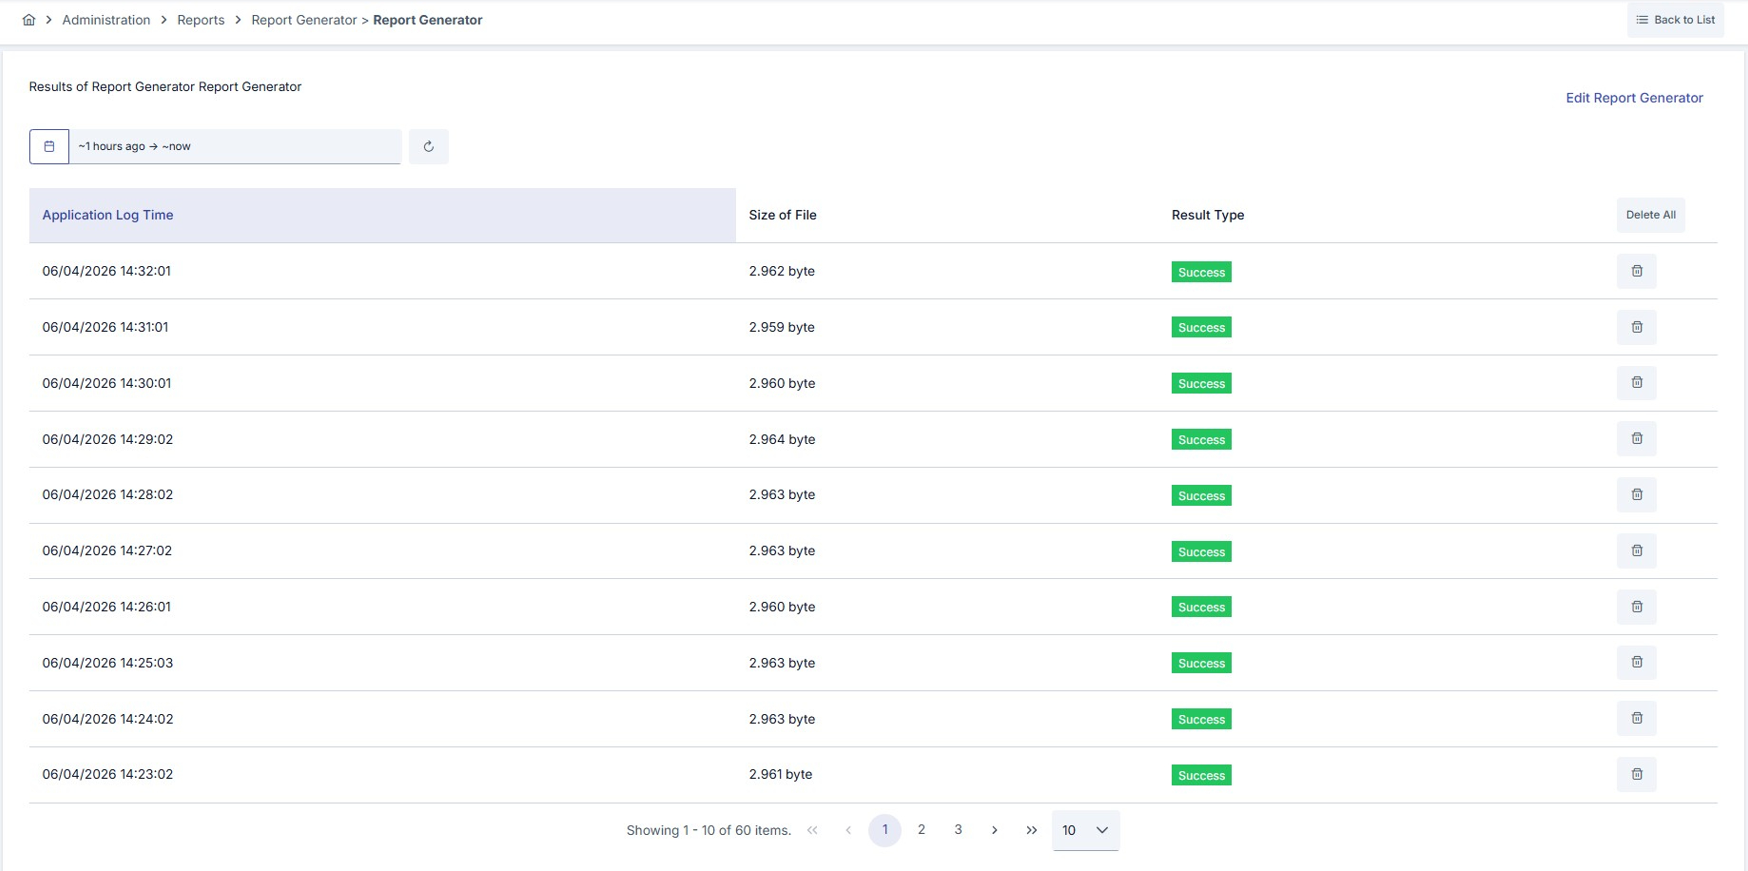
Report Results
Past run results of a saved Report Generator can be viewed from the detail screen opened by clicking the relevant record in the list. The Edit Report Generator link in the top right of the screen navigates to the definition edit page.
| Column | Description |
|---|---|
| Application Log Time | The date and time the report was run. |
| Size of File | The size of the generated report file (in bytes). |
| Result Type | Shows whether the report completed successfully or with an error. |
Date Range Filter
Results can be filtered using the date range picker at the top of the screen. Relative time ranges (e.g. "Last 1 hour") or fixed date ranges can be defined.
Result Management
- A single result record can be deleted using the delete icon on the right side of each row.
- All past results for that Report Generator can be cleared at once using the Delete All button in the table header.
Deleting all results is irreversible. It is recommended to export any necessary records before deleting.