Native OpenTelemetry Export from the Apinizer API Gateway — Agent-Free and GenAI-Aware
The Apinizer Gateway OpenTelemetry Integration series takes the agent-based road: a Java agent injected into the gateway pod, a Collector, Tempo, and a Prometheus Agent on Kubernetes. This article takes the other road — the one built into the product, with nothing to install. If you can attach a javaagent and want full-stack JVM instrumentation, the series is for you. If you want gateway-aware traces and AI token/cost telemetry with a connector and a single setting — and especially if you run outside Kubernetes — read on.
Two Roads to the Same Trace
Every request through an API Gateway is a story: it arrives, it's checked, it's routed to a backend (maybe two, if the first one fails), and it goes back. OpenTelemetry turns that story into a trace you can read. The question is only how the gateway tells it.
The agent road wires that story from outside the application: a javaagent watches the JVM and turns every HTTP, JDBC, and cache call into a span. It's powerful and broad, but it needs a place to attach the agent — typically a Kubernetes pod you control.
The native road tells the story from inside the product. Apinizer already records, for its own traffic log, exactly when each request arrived, how long each backend attempt took, and — for AI traffic — how many tokens were spent and what they cost. Native export takes that same data and speaks it as OpenTelemetry, straight to your collector. No agent, no sidecar, no deployment change.
A connector plus one per-environment setting. No javaagent, no init container, no pod annotation — so it works on a bare VM or a standalone install just as well as on Kubernetes.
AI Gateway traffic carries GenAI semantic-convention attributes and metrics — provider, model, token usage, cost, time-to-first-token — that a generic HTTP agent has no way to know.
Every span already carries the Apinizer correlation ID, project, and API proxy name, so a trace ties straight back to the traffic log without any extra pipeline configuration.
Run the javaagent and native export at once and Apinizer notices — it forces native off and logs a warning rather than sending every span twice.
This is not "the series plus a bit more." It's a different way to get the same traces out of the gateway. Pick one road per environment. The OpenTelemetry Export reference has the side-by-side comparison; the short version is at the end of this article.
What the Native Road Gives You
Turn export on and, for every request the gateway handles — REST, SOAP, and the server side of WebSocket/gRPC — you get a small span tree that mirrors how the request was actually handled:
| Span | Kind | The step it represents |
|---|---|---|
| Request span | SERVER | The whole request lifecycle, gateway in to gateway out |
| Backend attempt span | CLIENT | One span per attempt — a retry or a failover to a second target is its own span |
| Pipeline spans | INTERNAL | The request- and response-processing phases |
These spans are built after the fact from timings the gateway already had, so turning export on costs no new per-request measurement. And because Apinizer reads the incoming W3C traceparent and passes a fresh child context to the backend, a request that arrived as part of a larger distributed trace stays part of it — the caller's trace, the gateway's spans, and an instrumented backend's spans all land under one trace ID.
On top of that, AI Gateway traffic carries an extra layer that the generic road cannot produce: the GenAI inference span, and per-attempt failover legs, tagged with the model, the token counts, the cost, and the latency breakdown. That layer is where native export earns its keep, and it's the second half of this article.
Turning It On
There's no manifest to apply here — it's all in the product. Four moves and you're exporting.
Under connection management, add an OTLP Collector connector. Point Endpoint at your collector's base URL — http://collector:4318, not the full /v1/traces path; Apinizer appends the signal path itself. Choose the Protocol (HTTP/protobuf or gRPC), and if your collector needs auth, add an Auth Header — it's stored encrypted, like any other Apinizer secret. The batch-tuning defaults are sensible; leave them alone until you have a reason not to.
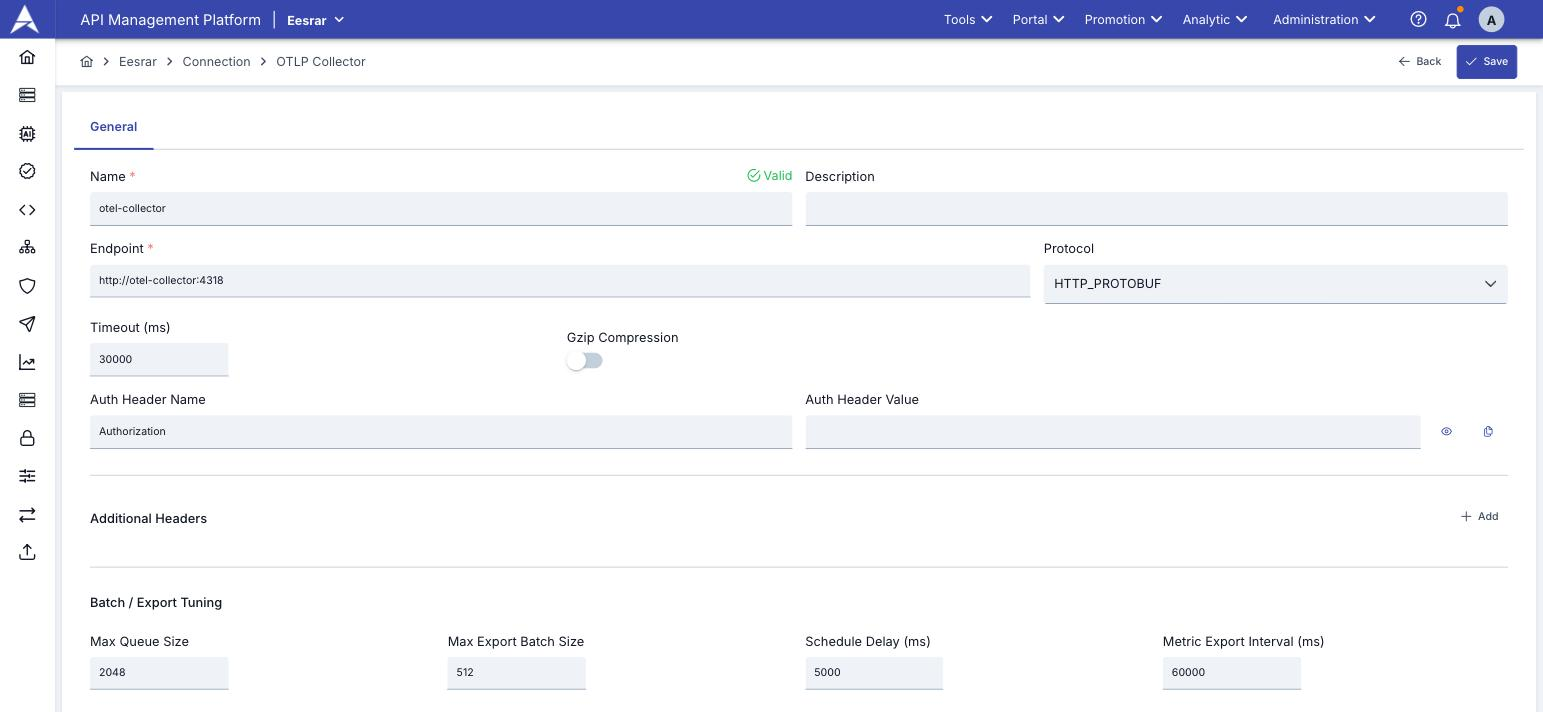
Hit Test Connection. This is the step people skip and regret. It is not a TCP ping — Apinizer builds a real exporter from your saved settings and sends one genuine synthetic span to the collector. If the auth header is wrong, the TLS chain doesn't validate, or the path is off, you find out here, on a button, instead of three days later wondering why your collector is empty.
In the target environment's OpenTelemetry Export section, set Export Mode to NATIVE and pick the connector you just tested. Mode is OFF by default and costs nothing until you opt in — and it's per-environment, so you can turn it on for staging, watch it for a day, and only then touch production.
Sampling Ratio decides how many new traces you keep. A request that already arrived with a sampled traceparent always inherits that decision — so this ratio only governs traces the gateway starts. On a high-traffic proxy, start low, watch your collector's ingest, and raise it deliberately.
That's the whole platform setup. One more setting exists but only matters for AI traffic — content capture — and it deserves its own discussion below, next to what it does and does not send.
Does It Actually Work?
The reassuring part of the native road is how little there is to verify, because the Test Connection step already proved the hard part — that your collector accepts Apinizer's payload end to end. After that, seeing real traffic is a matter of sending a request and looking.
Send a handful of requests through a proxy on the enabled environment, then open your collector's trace view (or its debug/file exporter if you're piloting locally). For a plain REST proxy you'll see the shape described above: a SERVER span, one CLIENT span per backend attempt, and the two pipeline spans nested underneath — the same tree whether the backend answered on the first try or the third.
Two things are worth checking on that first trace, because they're the two most common worries:
- The query string is gone.
url.pathcarries the path and nothing after the?. Header values, request and response bodies, and credentials never reach a span at all. Span names use the proxy's templated path, not the raw URI, so a million distinct URLs don't become a million distinct span names. - An incoming trace was joined, not replaced. If you send a request carrying a
traceparent, the gateway's SERVER span shows up as a child of that trace, and the call it makes to the backend carries a fresh childtraceparentonward. That's the whole point of propagation: one trace, end to end.
The usual cause is that Test Connection was never run, or was run against a different endpoint than the one saved. Native export sends silently and fails safe — a broken collector never breaks your traffic — so the connector test is your early-warning system. Run it again against the exact saved settings.
What an AI Request Looks Like
Here's where native export does something a generic HTTP agent simply can't. When the request is an AI call, the inference itself becomes a CLIENT span named for the operation and model — chat gpt-4o-mini, say — and it carries the GenAI semantic-convention attributes the rest of the OpenTelemetry ecosystem already understands:
| Attribute | What it tells you |
|---|---|
gen_ai.operation.name | chat, embeddings, execute_tool, invoke_agent, … |
gen_ai.provider.name | The well-known provider name (anthropic, aws.bedrock, …) |
gen_ai.request.model / gen_ai.response.model | What you asked for versus what actually answered — they differ on a failover |
gen_ai.usage.input_tokens / gen_ai.usage.output_tokens | The token counts, straight from the provider response |
Vendor-specific detail that has no home in the gen_ai.* namespace lives under apinizer.ai.* instead — the cost breakdown in micro-USD, the latency split (time-to-first-token, time-per-output-token), the semantic-cache hit flag, and apinizer.ai.failover.from when a second provider had to step in. The full list is in the AI Gateway OpenTelemetry reference.
When a request fails over, you don't lose the story — you gain spans: one CLIENT leg per attempt, so the trace shows exactly which provider was tried first, how long it took to give up, and which one finally answered. A semantic-cache hit is visible too: zero tokens, apinizer.ai.cache.hit=true, and no backend leg at all.
Metrics, Not Just Traces
Alongside the spans, AI traffic emits GenAI metric histograms over OTLP — gen_ai.client.token.usage, gen_ai.client.operation.duration, and Apinizer's cost and time-to-first-token histograms. These sit beside the gateway's existing apinizer_ai_* Prometheus metrics, which keep working untouched whether or not native export is on. The two families exist for different reasons: Prometheus is always-on and zero-config; the OTLP histograms carry true bucketed distributions, so you get real p50/p95/p99 rather than a pre-computed average. Scrape whichever your stack already has — or both.
The Prometheus family tags a provider with its raw code (bedrock); the OTLP family uses the normalized name (aws.bedrock). A dashboard variable built against one won't match the other. The provider-name mapping is the table to keep open the first time you build a panel.
Content Capture — Deliberately Off
The one AI-specific setting, Capture AI Prompt/Response Content, is off by default and should stay off unless you mean it. Turn it on and the prompt and response text ride along as span attributes — but only the text the client and backend actually saw, after PII masking has run, capped at a character limit you set. It never reads the raw pre-mask body. Even so, that's real conversation content leaving for your collector, so only enable it if the collector itself sits inside your compliance boundary. And note the honest gap: streaming responses are never content-captured, because there's no single response body to attach.
The Dashboard
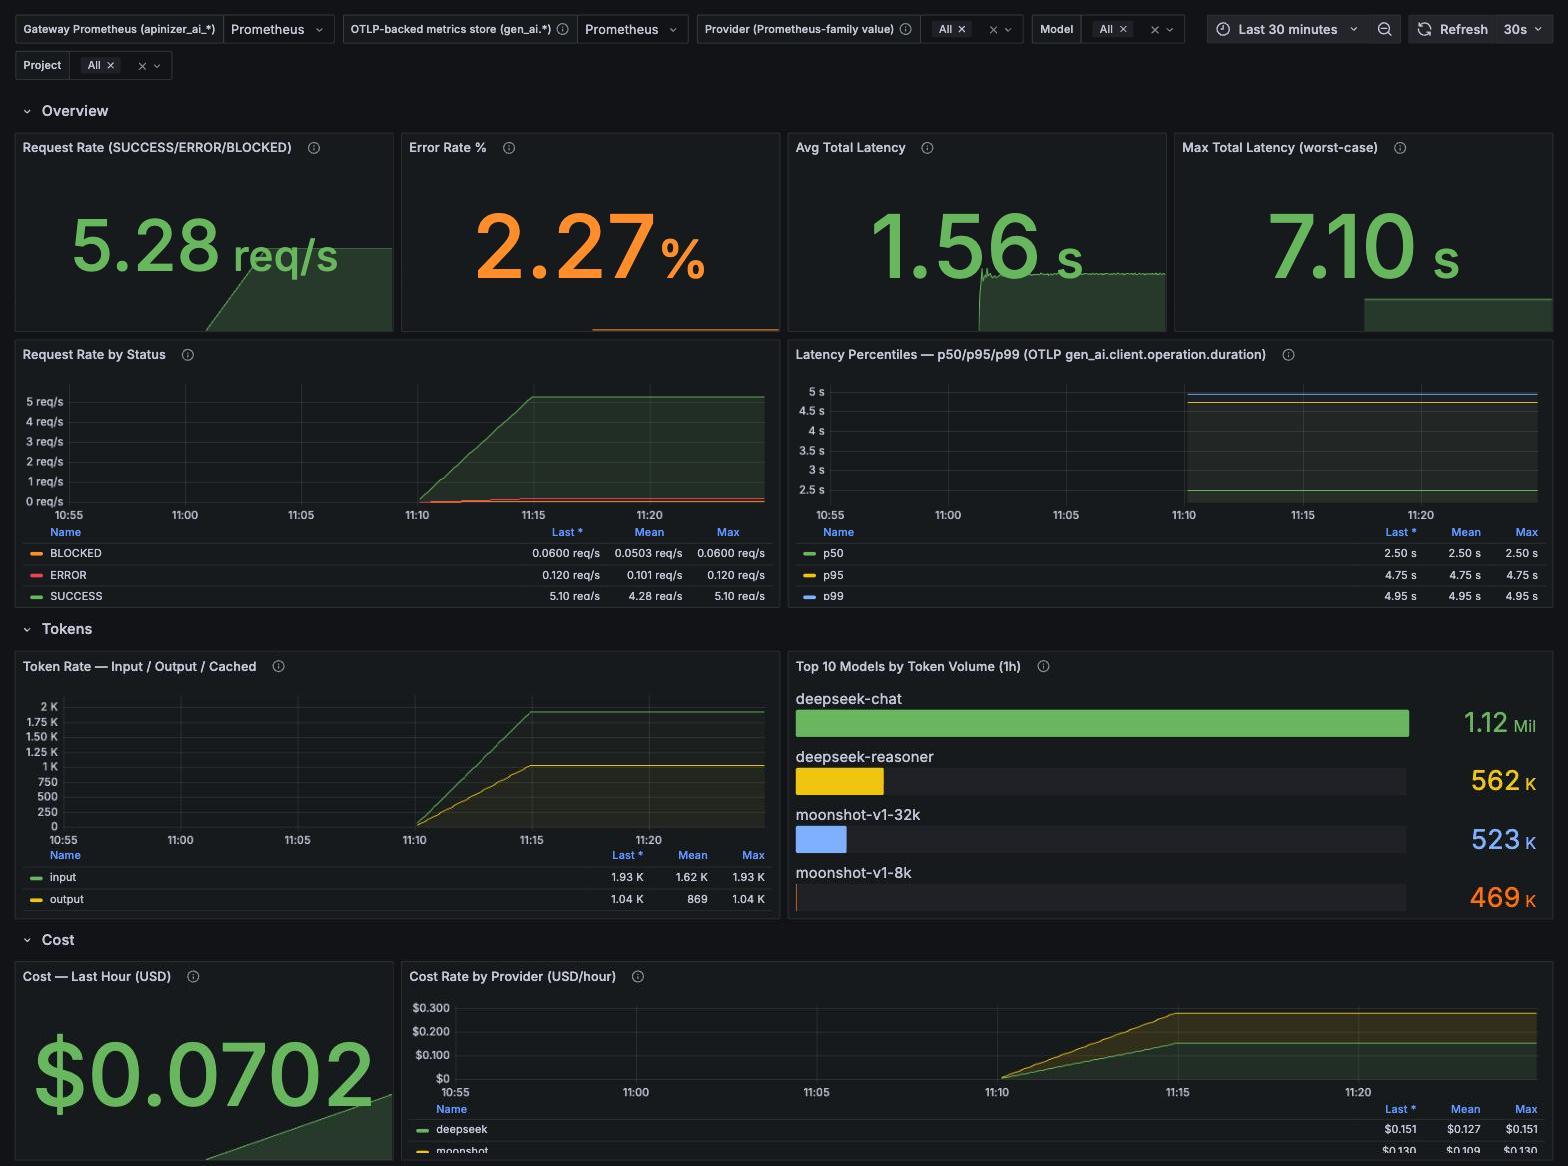
You don't have to build the panels from scratch. A ready-to-import Grafana dashboard ships with the docs, combining the Prometheus apinizer_ai_* family with the OTLP gen_ai.* histograms:
Download the dashboard JSON — Overview, Tokens, Cost, Streaming, Guardrail, Cache, and Reliability rows
Import it under Dashboards → New → Import, then point its two datasource variables at your Prometheus scrape target and at whatever Prometheus-compatible store your collector writes gen_ai.* metrics into. It is a metrics dashboard, not a trace one.
Two of its rows are worth a word, because they're honest about their own limits. The Cache and Reliability rows include a text panel calling out signals that live only at the span/trace level today — semantic-cache hit-rate and cost-avoided, and the failover-from/to detail — with no backing metric to query yet. Rather than ship an empty panel, the dashboard tells you to inspect those in the AI Trace timeline or with a TraceQL query on the attribute. It's a small thing, but it's the difference between a dashboard that lies by omission and one you can trust.
javaagent or Native?
The short version, for when someone asks which road to take:
| javaagent (the series) | Native (this article) | |
|---|---|---|
| To install | Java agent, via the OTel Operator on Kubernetes | Nothing — a connector and one setting |
| What it sees | The whole JVM: HTTP, JDBC, cache, everything | Apinizer's request lifecycle, plus the GenAI layer |
| AI awareness | Generic HTTP spans, no GenAI semantics | Token, cost, model, and latency attributes built in |
| Runs outside K8s | Needs a pod to attach to | Yes — a bare VM or standalone install is fine |
| Both at once | — | Detected and disabled automatically |
Neither is "better." The javaagent sees more of the JVM; native sees more of the meaning of AI traffic and needs no infrastructure. Many teams run the javaagent where they already have the Kubernetes machinery, and native everywhere else. What you must not do is run both against the same environment — and Apinizer's veto is there to make sure you can't do it by accident.
Known Limits
Native export is honest about its edges, so you're not surprised later:
- Streaming responses are never content-captured — there's no single body to attach.
- Policy and guardrail spans need Live Trace — the per-policy INTERNAL child spans only appear when Live Trace is active for that request; always-on export alone doesn't produce them.
- WebSocket and gRPC get server-side spans, not propagation — a SERVER span is produced, but joining an incoming
traceparentand forwarding one are HTTP/SOAP-only for now, so WS/gRPC always starts a fresh trace. - GenAI semantic conventions are pinned to a 2026-08 snapshot — still Development status upstream, so expect the occasional attribute rename, always called out in the release notes.
Wrapping Up
The agent-based series showed one way to observe the Apinizer gateway: attach a javaagent, run a Collector and Tempo, and read the JVM from the outside. Native export is the other way — the gateway tells its own story, straight to your collector, with no agent to install and with AI token, cost, and latency telemetry that a generic agent can't see. A connector, a Test Connection click, and one environment setting, and every request — REST, SOAP, or an AI call that failed over twice — shows up as a trace you can actually read.
For the exhaustive attribute and metric tables, the setup reference, and the full javaagent-versus-native comparison, keep these two pages close:
Setup, generic-traffic spans and attributes, and the javaagent comparison
The full GenAI attribute and metric reference, provider mapping, and content capture