Observing the Apinizer API Gateway with OpenTelemetry (Part 1): Architecture, Setup, and Verification
This is the first part of a four-part series on the Apinizer API Gateway and OpenTelemetry. In this part we'll walk through the architecture, setup, and verification of the integration together.
- OpenTelemetry Apinizer API Gateway integration: architecture, setup, verification (this part)
- Three Grafana dashboards: APM/RED, Collector Health, Tempo Ops
- SLI/SLO definitions: error budget and alerting
- Service graph: trace/metric/log correlation
Why Observability, Why OpenTelemetry?
You probably know this scenario: an alert fires, p95 latency has jumped to 800 ms. You look at the dashboard; yes, something is slow. But where? Did the upstream slow down, is the cache missing, or is the gateway itself the problem? Classic monitoring can't answer that question, because it only collects metrics: "requests per second", "error rate percentage", "p95 latency in ms". This data tells you that a problem exists, but not where it is.
An API Gateway is the most critical point traffic passes through: every request goes through it, and every slowdown or error becomes visible there first. OpenTelemetry (OTel) closes exactly this gap with distributed tracing. It is the vendor-neutral observability standard under the CNCF umbrella: with a single standard it collects three signals (traces, metrics, logs) and carries them to any backend you choose.
The OpenTelemetry Operator injects a Java agent into the gateway pod. Incoming requests, upstream calls, cache accesses, and database queries all turn into spans automatically, without writing a single line of code.
Telemetry data is not locked to a single product. You can use Tempo + Prometheus today and switch to a different backend tomorrow; the agent and Collector layers stay the same.
The OTLP protocol, W3C Trace Context propagation, and semantic conventions are widely accepted across the industry. They provide a common observability language across teams.
The Collector generates RED metrics (Rate, Errors, Duration) and a service dependency graph from trace data, reducing the need for a separate APM tool.
The Apinizer gateway continues to expose its own business metrics on port :9091 (request count, error rate, API proxy labels). OpenTelemetry makes the steps within a request (upstream call, cache access, DB query) visible at span level. In this integration the Collector gathers both sources; they work as complements, not replacements.
What Is a Trace and Why Does It Matter?
Metrics answer "how much?". Traces answer "why is it slow?" and "at which step did it break?". A trace is the complete record of a single request's journey through the system; each step in that journey is a span.
| Concept | Meaning | Example |
|---|---|---|
| Trace | End-to-end record of a single request | One API call's journey through gateway → cache → upstream |
| Span | A single step within a trace | The SERVER span for GET /orders, the CLIENT span to upstream |
| Trace ID | Identifier linking all spans | The 32-character value in the traceparent header |
| Context propagation | Carrying the Trace ID across steps | The traceparent header sent from gateway to upstream |
| Attribute | Key-value pair on a span | apinizer.correlation_id, http.status_code, peer.service |
Without traces you only see "p95 latency is 800 ms". With traces you see on one screen where those 800 ms went: 650 ms to upstream, 100 ms to a cache miss, 50 ms to the gateway pipeline. This breakdown cuts root cause analysis (RCA) time from hours to minutes.
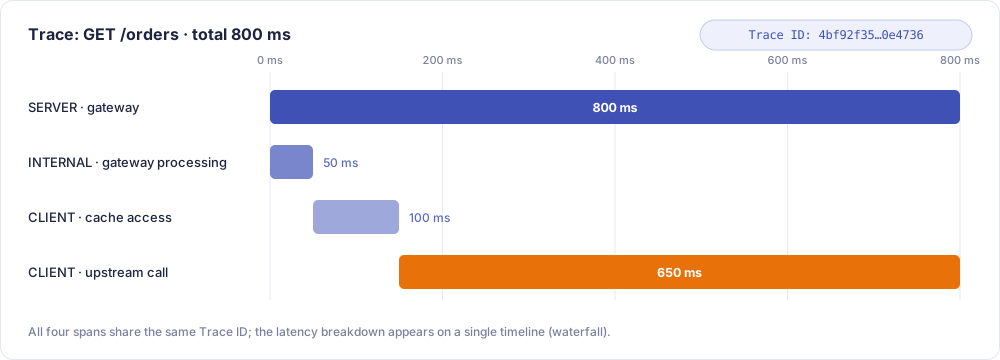
All of the spans above are linked under the same Trace ID; that is how you see the latency breakdown on a single waterfall.
How OpenTelemetry Actually Works
We can think of OpenTelemetry as three layers with clearly separated responsibilities. This separation keeps the "data producer" and "data storage" sides independent; that is exactly what enables true vendor independence.
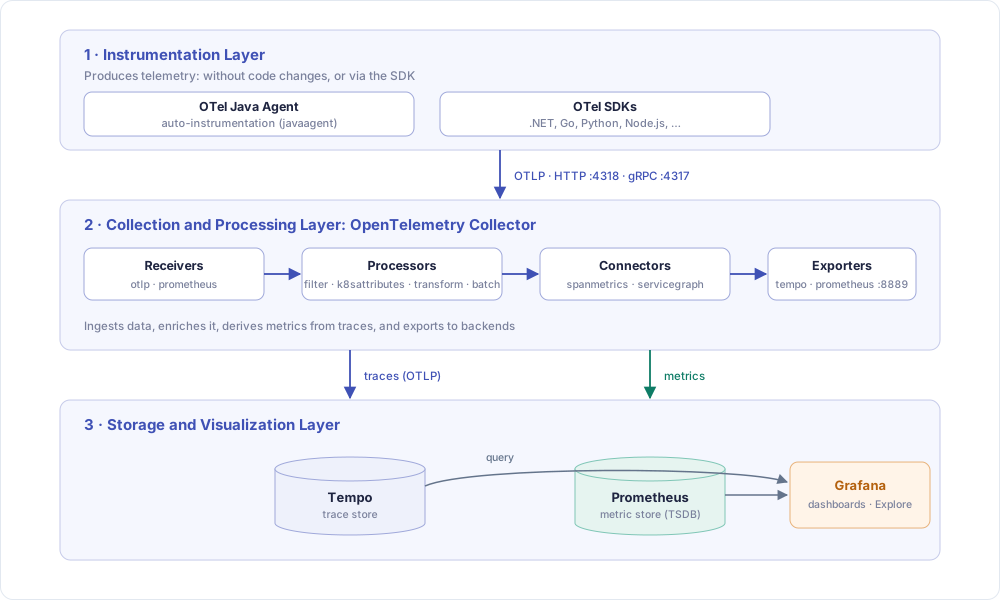
OpenTelemetry produces three signals:
- Traces: the request journey (the focus of this article)
- Metrics: time-series numeric data (RED, JVM, Apinizer native metrics)
- Logs: structured log records (disabled in this setup; no separate log backend is used)
These signals are carried over OTLP (OpenTelemetry Protocol). Standard ports: :4318 for HTTP, :4317 for gRPC.
The Collector is the heart of the architecture, a processing pipeline made of four component types:
| Component | Role |
|---|---|
| Receiver | Ingests data (spans arriving over OTLP, scraped Prometheus metrics) |
| Processor | Transforms data (noise filtering, adding k8s labels, business-context enrichment, batching) |
| Connector | Produces one signal from another (trace-to-metric: spanmetrics, servicegraph) |
| Exporter | Writes data out (traces to Tempo, Prometheus metrics on port :8889) |
The Big Picture: The Apinizer Integration Architecture
The diagram below shows the full path a request takes from entering the gateway to reaching Tempo and the central Prometheus. The namespace the gateway runs in varies by environment; we denote it as <worker-namespace> in the diagram and commands.
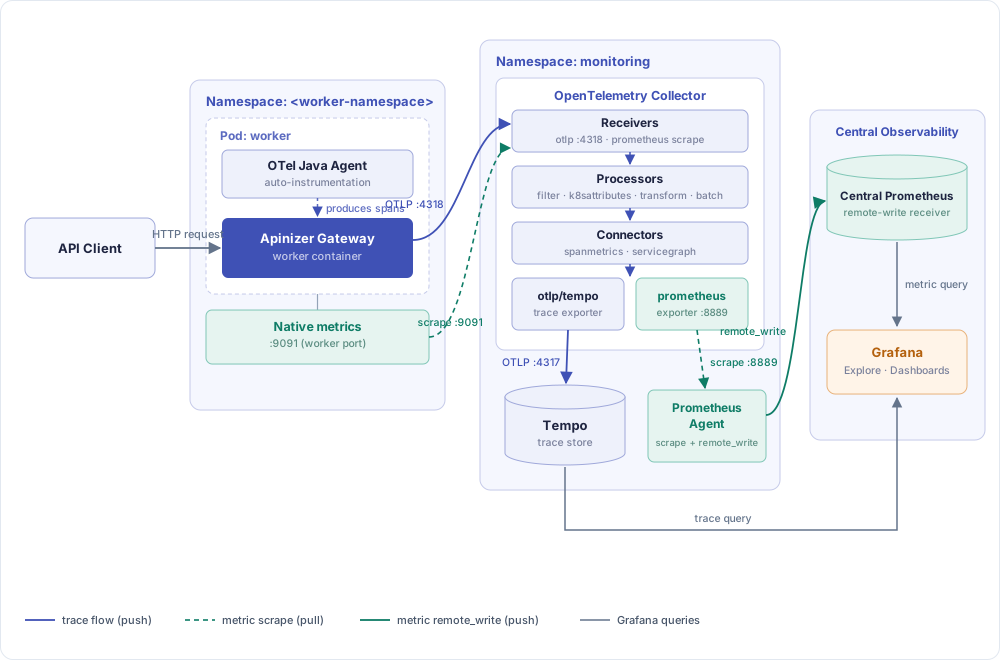
The data travels along two separate pipelines and meets in Grafana:
- Trace pipeline: Gateway → Java agent → OTLP → Collector → Tempo → Grafana (Explore)
- Metric pipeline: Gateway native
:9091and trace-derived metrics → Collector:8889→ Prometheus Agent (scrape) →remote_write→ Central Prometheus → Grafana
Who Does What?
| Component | Namespace | Role |
|---|---|---|
| OTel Operator | monitoring | Reads the Instrumentation CR (Custom Resource) and injects a Java agent init container into the gateway deployment |
| OTel Java Agent | <worker-namespace> (worker pod) | Turns HTTP/JDBC/cache calls into spans without changing gateway code |
| OTel Collector | monitoring | Processes spans and writes them to Tempo; derives RED/service-graph metrics from traces; collects native :9091 metrics; publishes all on :8889 |
| Tempo | monitoring | Trace store — WAL (Write-Ahead Log) + blocks; the trace source for Grafana Explore |
| Prometheus Agent | monitoring | Scrapes the Collector's :8889 and forwards via remote_write to the central Prometheus; keeps no local TSDB (Time Series Database) |
| Central Prometheus | Central/remote | Metric TSDB; the remote_write receiver; Grafana's metric source |
| Grafana | Central/remote | Visualizes traces (Tempo) and metrics (Prometheus) |
How Does the Agent Get into the Gateway Pod?
Here's the nice part: the OpenTelemetry Operator does not even add a separate sidecar container next to the gateway. Instead, it injects an init container that runs before the pod starts. This init container writes the agent JAR to a shared volume and passes the required JVM settings to the worker container.
So what triggers this whole mechanism? A single annotation you need to add to your application's deployment pod template:
metadata:
  annotations:
    instrumentation.opentelemetry.io/inject-java: "apinizer-instr"
The annotation must live under spec.template.metadata.annotations. If you write it in the deployment's top-level metadata, the webhook will not mutate the pod and the agent will not be injected.
What Does a Span Go Through inside the Collector?
Every span leaving the gateway passes through the Collector's traces pipeline. The diagram below shows a single span's journey from the receiver to Tempo and to the derived metrics.
The role of each processor in the traces pipeline:
| Processor | What does it do? | Why is it needed in Apinizer? |
|---|---|---|
memory_limiter | Protects Collector memory, prevents OOM (Out of Memory) | Under load the gateway can produce thousands of spans/second |
filter/drop_mongo_polling | Drops MongoDB polling and management endpoint spans | Reduces noise; lets you focus on real API traffic |
k8sattributes | Adds pod, namespace, node, deployment labels | You can see which pod is slow from the trace |
resourcedetection | Adds host/OS info | Environment-based filtering |
transform/apinizer-traces | Writes Apinizer business context into span attributes | Correlation ID, API proxy name, upstream address |
batch | Groups spans and sends in bulk | Reduces network overhead, efficient writes to Tempo |
Connectors generate metrics within the same Collector without exporting spans externally:
spanmetrics: derives request count, error count, and a duration histogram (RED metrics) from each span.servicegraph: derives service dependency metrics from CLIENT→SERVER span relationships; Grafana Service Graph uses these.
Before We Start
Here's what we need in place before diving in:
A cluster where you can use kubectl and helm with admin access.
A gateway (worker) deployment running in a namespace.
A central Prometheus with the remote-write receiver enabled, and a Grafana connected to it.
A static PV/PVC (PersistentVolume/PersistentVolumeClaim) or a StorageClass for Tempo.
We install the observability components into the monitoring namespace. The gateway runs in its own namespace, which we denote as <worker-namespace> in the commands. Don't forget to replace this value with your own gateway namespace as you go.
Let's Build It
Enough theory; time to get our hands dirty. We'll bring the whole chain up in seven steps.
kubectl create namespace monitoring
No cert-manager in the cluster? No problem: we can let Helm generate the webhook certificate itself:
helm repo add open-telemetry https://open-telemetry.github.io/opentelemetry-helm-charts
helm repo update

helm install opentelemetry-operator open-telemetry/opentelemetry-operator \
  --namespace monitoring \
  --set admissionWebhooks.certManager.enabled=false \
  --set admissionWebhooks.autoGenerateCert.enabled=true \
  --set admissionWebhooks.autoGenerateCert.recreate=true
Then we wait until the operator pod is Running and the CRDs (Custom Resource Definitions) show up:
kubectl get pods -n monitoring -l app.kubernetes.io/name=opentelemetry-operator
kubectl get crd | grep opentelemetry
Tempo stores traces on a persistent disk. The manifest below uses a static PV/PVC and solves the hostPath permission issue up front with an initContainer (more on that in the problems section at the end).
tempo.yaml (full manifest)
apiVersion: v1
kind: PersistentVolume
metadata:
  name: tempo-pv
spec:
  capacity:
    storage: 5Gi
  accessModes: [ReadWriteOnce]
  persistentVolumeReclaimPolicy: Retain
  storageClassName: ""
  hostPath:
    path: /data/tempo
---
apiVersion: v1
kind: PersistentVolumeClaim
metadata:
  name: tempo-pvc
  namespace: monitoring
spec:
  accessModes: [ReadWriteOnce]
  storageClassName: ""
  resources:
    requests:
      storage: 5Gi
  volumeName: tempo-pv
---
apiVersion: v1
kind: ConfigMap
metadata:
  name: tempo-config
  namespace: monitoring
data:
  tempo.yaml: |
    server:
      http_listen_port: 3200
      grpc_listen_port: 9095
    distributor:
      receivers:
        otlp:
          protocols:
            grpc:
              endpoint: 0.0.0.0:4317
            http:
              endpoint: 0.0.0.0:4318
    ingester:
      max_block_duration: 5m
    compactor:
      compaction:
        block_retention: 48h
    storage:
      trace:
        backend: local
        wal:
          path: /var/tempo/wal
        local:
          path: /var/tempo/blocks
    usage_report:
      reporting_enabled: false
---
apiVersion: apps/v1
kind: Deployment
metadata:
  name: tempo
  namespace: monitoring
  labels: { app: tempo }
spec:
  replicas: 1
  strategy:
    type: Recreate
  selector:
    matchLabels: { app: tempo }
  template:
    metadata:
      labels: { app: tempo }
    spec:
      securityContext:
        fsGroup: 10001
        runAsUser: 10001
        runAsGroup: 10001
      initContainers:
        - name: init-chown
          image: busybox:1.36
          command:
            - sh
            - -c
            - mkdir -p /var/tempo/wal /var/tempo/blocks && chown -R 10001:10001 /var/tempo
          securityContext:
            runAsUser: 0
          volumeMounts:
            - { name: storage, mountPath: /var/tempo }
      containers:
        - name: tempo
          image: grafana/tempo:2.7.1
          args: ["-config.file=/etc/tempo/tempo.yaml"]
          ports:
            - { containerPort: 3200, name: http }
            - { containerPort: 4317, name: otlp-grpc }
            - { containerPort: 4318, name: otlp-http }
          volumeMounts:
            - { name: config, mountPath: /etc/tempo }
            - { name: storage, mountPath: /var/tempo }
      volumes:
        - name: config
          configMap: { name: tempo-config }
        - name: storage
          persistentVolumeClaim:
            claimName: tempo-pvc
---
apiVersion: v1
kind: Service
metadata:
  name: tempo
  namespace: monitoring
  labels: { app: tempo }
spec:
  selector: { app: tempo }
  ports:
    - { name: http, port: 3200, targetPort: 3200 }
    - { name: otlp-grpc, port: 4317, targetPort: 4317 }
    - { name: otlp-http, port: 4318, targetPort: 4318 }
kubectl apply -f tempo.yaml
kubectl get pvc -n monitoring
kubectl get pods -n monitoring -l app=tempo
The Collector is the busiest piece of this setup: it processes the spans coming from the gateway, enriches them with business context, writes traces to Tempo, derives RED/service-graph metrics from spans, and collects the gateway's native :9091 metrics, publishing everything on port :8889 for Prometheus.
otel-collector.yaml (full manifest)
apiVersion: opentelemetry.io/v1beta1
kind: OpenTelemetryCollector
metadata:
  name: otel
  namespace: monitoring
spec:
  image: ghcr.io/open-telemetry/opentelemetry-collector-releases/opentelemetry-collector-contrib:0.153.0
  mode: deployment
  replicas: 1
  config:
    connectors:
      servicegraph:
        dimensions: [server.address, http.request.method]
        latency_histogram_buckets: [10ms, 50ms, 100ms, 250ms, 1s, 5s]
      spanmetrics:
        dimensions:
          - name: apinizer.apiproxy.name
          - name: server.address
          - name: peer.service
          - name: apinizer.span.role
          - name: http.request.method
        exemplars: { enabled: true }
        histogram:
          explicit:
            buckets: [10ms, 25ms, 50ms, 100ms, 250ms, 500ms, 1s, 2s, 5s]
        metrics_flush_interval: 15s
        namespace: apinizer.trace
    receivers:
      otlp:
        protocols:
          grpc: { endpoint: 0.0.0.0:4317 }
          http: { endpoint: 0.0.0.0:4318 }
      prometheus/apinizer-native:
        config:
          scrape_configs:
            - job_name: apinizer-worker-native
              scrape_interval: 15s
              kubernetes_sd_configs:
                - role: pod
                  namespaces:
                    names: [<worker-namespace>]
              relabel_configs:
                - action: keep
                  regex: "9091"
                  source_labels: [__meta_kubernetes_pod_container_port_number]
                - source_labels: [__meta_kubernetes_namespace]
                  target_label: k8s_namespace
                - source_labels: [__meta_kubernetes_pod_name]
                  target_label: k8s_pod
    processors:
      batch: { send_batch_size: 1024, timeout: 5s }
      memory_limiter: { check_interval: 1s, limit_percentage: 80, spike_limit_percentage: 25 }
      resourcedetection: { detectors: [env, system], timeout: 5s }
      k8sattributes:
        auth_type: serviceAccount
        extract:
          metadata: [k8s.namespace.name, k8s.pod.name, k8s.node.name, k8s.deployment.name]
      filter/drop_mongo_polling:
        error_mode: ignore
        traces:
          span:
            - IsRootSpan() and (attributes["db.system"] == "mongodb" or attributes["db.system.name"] == "mongodb")
            - IsMatch(attributes["http.route"], "^/apinizer/management")
      transform/apinizer-traces:
        error_mode: ignore
        trace_statements:
          - context: span
            statements:
              - set(attributes["apinizer.correlation_id"], attributes["http.response.header.apinizer-correlation-id"][0]) where attributes["http.response.header.apinizer-correlation-id"] != nil
              - set(attributes["apinizer.correlation_id"], attributes["http.request.header.apinizer-correlation-id"][0]) where attributes["apinizer.correlation_id"] == nil and attributes["http.request.header.apinizer-correlation-id"] != nil
              - set(attributes["apinizer.correlation_id"], attributes["http.response.header.apinizer_correlation_id"][0]) where attributes["apinizer.correlation_id"] == nil and attributes["http.response.header.apinizer_correlation_id"] != nil
              - set(attributes["apinizer.apiproxy.name"], attributes["http.response.header.x-apinizer-apiproxy-name"][0]) where attributes["http.response.header.x-apinizer-apiproxy-name"] != nil
              - set(attributes["apinizer.apiproxy.path"], attributes["url.path"]) where attributes["url.path"] != nil
              - set(attributes["apinizer.routing.address"], attributes["url.full"]) where kind == SPAN_KIND_CLIENT and attributes["url.full"] != nil
              - set(attributes["peer.service"], attributes["server.address"]) where kind == SPAN_KIND_CLIENT and attributes["server.address"] != nil
              - set(attributes["apinizer.span.role"], "elasticsearch-logging") where kind == SPAN_KIND_CLIENT and IsMatch(attributes["server.address"], ".*(elastic|9200).*")
              - set(attributes["apinizer.span.role"], "upstream-routing") where kind == SPAN_KIND_CLIENT and attributes["apinizer.span.role"] == nil
    exporters:
      debug: { verbosity: basic }
      otlp/tempo:
        endpoint: tempo.monitoring.svc.cluster.local:4317
        tls: { insecure: true }
      prometheus:
        enable_open_metrics: true
        endpoint: 0.0.0.0:8889
        resource_to_telemetry_conversion: { enabled: true }
    service:
      telemetry:
        logs: { level: info }
        metrics:
          readers:
            - pull:
                exporter:
                  prometheus: { host: 0.0.0.0, port: 8888 }
      pipelines:
        traces:
          receivers: [otlp]
          processors: [memory_limiter, filter/drop_mongo_polling, k8sattributes, resourcedetection, transform/apinizer-traces, batch]
          exporters: [otlp/tempo, spanmetrics, servicegraph]
        metrics:
          receivers: [otlp, prometheus/apinizer-native, spanmetrics, servicegraph]
          processors: [memory_limiter, batch]
          exporters: [prometheus]
Don't forget to set the namespaces.names field of the prometheus/apinizer-native receiver to your gateway's namespace (<worker-namespace>). The operator creates a service named otel-collector from this manifest; the agent and Prometheus Agent will connect to it.
kubectl apply -f otel-collector.yaml
kubectl get pods -n monitoring -l app.kubernetes.io/name=otel-collector
This resource tells the agent where to send telemetry. We use the OTLP HTTP port 4318 and disable the log signal (avoiding unnecessary 404 noise up front, since there is no log backend). We create the CR in the gateway's namespace.
# instrumentation.yaml
apiVersion: opentelemetry.io/v1alpha1
kind: Instrumentation
metadata:
  name: apinizer-instr
  namespace: <worker-namespace>
spec:
  exporter:
    endpoint: http://otel-collector.monitoring.svc.cluster.local:4318
  propagators: [tracecontext, baggage]
  sampler:
    type: parentbased_traceidratio
    argument: "1"
  env:
    - name: OTEL_LOGS_EXPORTER
      value: "none"
kubectl apply -f instrumentation.yaml
kubectl get instrumentation -n <worker-namespace>
Once the agent is active, you will see a header like this on the gateway's outgoing calls:
traceparent: 00-062ad6a79d1b48e4372ac9a5c042e8e7-c3feb0b529b5ed40-03
This comes from the propagators: [tracecontext, baggage] setting in the Instrumentation CR and is the W3C Trace Context standard itself. Its purpose is context propagation: carrying the trace ID to the upstream, so that if the backend is also instrumented, its spans join the gateway's trace under the same record. The format reads as version-traceId-parentSpanId-flags; the last part carries flags such as sampling.
If the backend is not instrumented, the header is harmless and usually ignored. Still, be careful: services with strict header validation, WAFs/proxies enforcing header whitelists, or legacy services that include headers in signature calculations may reject the request because of this unexpected header. If you run into this, narrow the propagators list or strip the header with a gateway policy on requests going to the affected backend.
The Apinizer startup script sets the JVM Metaspace ceiling in tiers based on the container memory limit (1 GiB → 128m, 2 GiB → 192m, 4 GiB → 256m). The OpenTelemetry Java agent adds roughly 15-25 MB of instrumentation classes to Metaspace; on a 1 GiB Worker this overhead, combined with the real proxy and policy class load, can fill the 128m ceiling and cause deploy/management request failures with java.lang.OutOfMemoryError: Metaspace. Heap percentage settings do not grow Metaspace.
- Set the memory limit of any Worker pod that will receive the agent to at least 2 GiB; 4 GiB is recommended for production.
- A 1 GiB limit is not sufficient for any Worker; even with a single CPU core the JVM does not start on it. The minimum is 2 GiB with or without the agent.
- Raising only
-XX:MaxMetaspaceSizeviaJAVA_OPTSwithout raising the pod limit can push total native memory over the container limit (OOMKilled risk); the proper fix is increasing the memory limit.
See Kubernetes Environment for resource configuration and Memory Leaks and OOM Errors for symptoms and diagnosis.
All it takes to trigger agent injection is adding the annotation to the deployment's pod template:
kubectl patch deployment worker -n <worker-namespace> --type merge -p \
'{"spec":{"template":{"metadata":{"annotations":{"instrumentation.opentelemetry.io/inject-java":"apinizer-instr"}}}}}'

kubectl rollout status deployment worker -n <worker-namespace>
The annotation must live under spec.template.metadata.annotations; if you place it in the deployment's top-level metadata, injection will not happen.
To forward gateway metrics to a central Prometheus without storing them locally, we run Prometheus in agent mode. We do target discovery declaratively with a ServiceMonitor rather than scrape_configs; this requires the Prometheus Operator's CRDs. If kube-prometheus-stack is installed in your cluster, these CRDs already exist; otherwise you'll need to install the Prometheus Operator separately.
First, the service account and RBAC (Role-Based Access Control) definitions for the agent:
prometheus-agent-rbac.yaml
apiVersion: v1
kind: ServiceAccount
metadata:
  name: prometheus-agent
  namespace: monitoring
---
apiVersion: rbac.authorization.k8s.io/v1
kind: ClusterRole
metadata:
  name: prometheus-agent
rules:
  - apiGroups: [""]
    resources: [nodes, nodes/metrics, services, endpoints, pods]
    verbs: [get, list, watch]
  - nonResourceURLs: ["/metrics"]
    verbs: [get]
---
apiVersion: rbac.authorization.k8s.io/v1
kind: ClusterRoleBinding
metadata:
  name: prometheus-agent
roleRef:
  apiGroup: rbac.authorization.k8s.io
  kind: ClusterRole
  name: prometheus-agent
subjects:
  - kind: ServiceAccount
    name: prometheus-agent
    namespace: monitoring
Then the PrometheusAgent CR and the ServiceMonitor that discovers the Collector:
# prometheus-agent.yaml
apiVersion: monitoring.coreos.com/v1alpha1
kind: PrometheusAgent
metadata:
  name: gateway-agent
  namespace: monitoring
spec:
  replicas: 1
  serviceAccountName: prometheus-agent
  externalLabels:
    cluster: apinizer-gw          # to distinguish this cluster in the central Prometheus
  serviceMonitorSelector:
    matchLabels:
      release: gateway-agent      # the ServiceMonitor below matches this label
  remoteWrite:
    - url: http://<central-prometheus-host>:9090/api/v1/write
      # if needed:
      # basicAuth: { username: {...}, password: {...} }
---
apiVersion: monitoring.coreos.com/v1
kind: ServiceMonitor
metadata:
  name: otel-collector
  namespace: monitoring
  labels:
    release: gateway-agent
spec:
  namespaceSelector:
    matchNames: [monitoring]
  selector:
    matchLabels:
      app.kubernetes.io/name: otel-collector   # label of the collector service
  endpoints:
    - port: prometheus            # name of the Collector's :8889 port
      interval: 15s
kubectl apply -f prometheus-agent-rbac.yaml
kubectl apply -f prometheus-agent.yaml
kubectl get pods -n monitoring -l app.kubernetes.io/name=prometheus-agent
Prometheus does not accept remote_write by default. If the central Prometheus is not started with the --web.enable-remote-write-receiver flag, the agent will get a 404 on every send. We cover the details below, in the problems-we-hit section.
spec.selector.matchLabels and endpoints.port must match the Collector service's actual labels and port name. To check: look at kubectl get svc -n monitoring --show-labels and the :8889 port name in kubectl get svc otel-collector -n monitoring -o yaml.
Does It Actually Work?
The setup is done, but we're not finished yet; we test the chain at four points: agent injection, export health, traces in Tempo, and metric flow to the central Prometheus.
1. Was the agent really injected?
# the initContainer should appear (opentelemetry-auto-instrumentation-java)
kubectl describe pod -n <worker-namespace> -l app=worker | grep -A3 -i "init container"

# the worker container env should contain agent settings
kubectl exec -n <worker-namespace> deploy/worker -c worker -- env | grep -i -E "otel_exporter|java_tool"
The output we expect looks like this:
JAVA_TOOL_OPTIONS=-javaagent:/otel-auto-instrumentation-java/agent.jar
OTEL_EXPORTER_OTLP_ENDPOINT=http://otel-collector.monitoring.svc.cluster.local:4318
OTEL_LOGS_EXPORTER=none
2. Are the exports healthy?
kubectl logs -n <worker-namespace> deploy/worker -c worker | grep -i -E "otel.javaagent|Failed to export"
The log should show the opentelemetry-javaagent banner; there should be no Failed to export spans or Failed to export logs ... 404 lines.
3. Are traces showing up in Tempo?
Let's send a few requests through the gateway and open Explore → Tempo in Grafana:
{resource.service.name="worker"}
Each row is an end-to-end trace record for a request. Clicking a row opens its spans as a waterfall; each span represents a processing step:
| Span type | What does it show? |
|---|---|
| SERVER span | Gateway receiving and processing the request (policy, routing pipeline) |
| CLIENT span | Outgoing call from the gateway to upstream, cache, or Elasticsearch |
| INTERNAL span | In-JVM operations (serialization, thread pool) |
4. Are metrics reaching the central Prometheus?
We verify that the Prometheus Agent actually forwards metrics remotely from two vantage points.
a) remote_write health on the agent side: Let's look at the remote_storage counters on the agent's own /metrics endpoint:
kubectl port-forward -n monitoring pod/prometheus-gateway-agent-0 9090:9090
# in another terminal:
curl -s localhost:9090/metrics | grep -E "prometheus_remote_storage_(samples_failed_total|sent_batch_duration_seconds_count|queue_highest_sent_timestamp_seconds)"
In a healthy output:
prometheus_remote_storage_sent_batch_duration_seconds_countshould be increasing (sending is ongoing),prometheus_remote_storage_samples_failed_totalshould be stable (a non-increasing counter = no permanent rejections),queue_highest_sent_timestamp_secondsshould be close to the current time (no lag).
b) Definitive confirmation on the central Prometheus side: Let's query with the cluster label we added via externalLabels:
up{cluster="apinizer-gw"}
count by (job) ({cluster="apinizer-gw"})
traces_service_graph_request_total{cluster="apinizer-gw"}
If up{cluster="apinizer-gw"} == 1 and traces_service_graph_* metrics are arriving, the gateway metrics are reaching the central Prometheus; the integration is working end to end.
At the end of this setup: the gateway is instrumented without code changes, every API request's trace appears in Tempo, and gateway metrics are collected by the Prometheus Agent and written via remote_write to the central Prometheus. A stable samples_failed_total and up{cluster="apinizer-gw"} == 1 on the central Prometheus are the definitive proof that the metric flow is healthy.
A Closer Look at the Collector Configuration
The service.pipelines block in the manifest translates the Collector internals from the architecture diagram into YAML:
pipelines:
  traces:
    receivers: [otlp]
    processors: [memory_limiter, filter/drop_mongo_polling, k8sattributes, resourcedetection, transform/apinizer-traces, batch]
    exporters: [otlp/tempo, spanmetrics, servicegraph]
  metrics:
    receivers: [otlp, prometheus/apinizer-native, spanmetrics, servicegraph]
    processors: [memory_limiter, batch]
    exporters: [prometheus]
The traces pipeline manages only the span flow. Although spanmetrics and servicegraph appear here as exporters, they are actually connectors: they generate metrics from spans without exporting them externally and feed the metrics pipeline.
The metrics pipeline gathers metrics from four sources:
| Source | What does it provide? |
|---|---|
prometheus/apinizer-native | Native Apinizer metrics from the gateway's :9091 port |
spanmetrics (connector) | RED metrics derived from traces |
servicegraph (connector) | Service dependency metrics |
otlp | Direct metrics from the agent (if any) |
All metrics are published on port :8889 via the prometheus exporter; the Prometheus Agent scrapes this port through the ServiceMonitor.
The Problems We Hit Along the Way (and How We Fixed Them)
We ran into four classic traps while setting this up; chances are you'll hit at least one of them too. Here they are, so you don't have to rediscover them:
Spans are produced but do not appear in Tempo (OTLP port/protocol)
The OpenTelemetry Java agent's default OTLP protocol is http/protobuf, which expects HTTP port 4318. If you point the endpoint at the gRPC port 4317, the agent connects but every export fails, and you see the log warning port is likely incorrect for protocol version "http/protobuf". Fix: set the endpoint to 4318 in the Instrumentation CR (or set the protocol to gRPC and keep 4317).
Continuous HTTP 404 warnings for logs
The agent sends the log signal by default. If the Collector has no logs pipeline, the request to /v1/logs returns 404 and the log stream keeps showing Failed to export logs ... 404 Not Found. Traces and metrics are unaffected. If you are not using a log backend, add OTEL_LOGS_EXPORTER=none to the Instrumentation CR to remove this noise.
Tempo won't start: mkdir /var/tempo/blocks permission denied
The grafana/tempo image runs as a non-root user (uid 10001). For hostPath volumes, the kubelet does not apply ownership based on fsGroup, so if the node directory is owned by root, Tempo cannot write. Fix: add an initContainer that runs chown as root (present in the manifest above), or run chown -R 10001:10001 /data/tempo on the node.
remote_write fails: 404 remote write receiver needs to be enabled
In the agent logs you see: server returned HTTP status 404 Not Found: remote write receiver needs to be enabled with --web.enable-remote-write-receiver. This tells you the error is not in the agent, but in the central Prometheus: the remote-write receiver endpoint (/api/v1/write) is disabled. Prometheus does not accept remote-write by default. Fix: start the central Prometheus with the --web.enable-remote-write-receiver flag (add it to the deployment's container args list). Once added, the samples_failed_total growth stops and the up{cluster="apinizer-gw"} data appears on the central side.
Even if the remote_write data looks current (queue_highest_sent_timestamp appears to advance), the definitive source of truth is the agent logs. Timestamps can be misleading; the non-recoverable error line in the log tells you the real state.
Wiring Up Grafana
We define two data sources in Grafana:
- Tempo: Connections → Data sources → Add data source → Tempo, URL:
http://tempo.monitoring.svc.cluster.local:3200. You query traces from the Explore screen. - Prometheus: the address of your central Prometheus. Because metrics are written here by the agent via
remote_write, all dashboards and the service graph query this source (in agent mode the local Prometheus cannot be queried).
Wrapping Up
In this part we first talked about why and how OpenTelemetry works: the three signals, the Collector's receiver/processor/connector/exporter structure, and how traces differ from metrics. We then instrumented the Apinizer API Gateway with the Operator without code changes, streamed traces to Tempo through the Collector, and collected gateway metrics with a Prometheus Agent, forwarding them to the central Prometheus via remote_write. Finally we verified the setup at four points and worked through the typical issues we hit along the way (OTLP port/protocol, log 404, Tempo permissions, remote-write receiver).
In the next part we'll make this data visible: APM/RED dashboards, a Collector health panel, and Tempo operational metrics in Grafana. See you there!