API Consumption Trend
What Is It For?
- Shows the request volume coming through portal subscriptions as a time series, grouped by day/week/month
- Lets you compare each organization's traffic as a separate line
- Splits the period in half to reveal whether each organization's consumption is growing or shrinking compared to the first half
Who Uses It?
- Portal Administrators: To monitor the overall platform usage trend over time
- Business Development / Sales Teams: To spot organizations with growing consumption as upsell opportunities, and organizations with shrinking consumption as an early churn signal
- Product Owners: To see how demand for a specific API product changes over time
Screen Access and Permissions
- In the Admin panel's left menu, follow Portal → Reports → Consumption Trend.
- Only authorized roles (Portal Manager, Admin, Portal Business) can view this report.
Tip
For live quota, blocks, and the request drawer, use Traffic & Usage; for product × organization × app summary metrics, use API Traffic Report.
Info
Request counts here attribute traffic to an application whose identity is a typed API Client (client ID matching the traffic row's username/key), not only to one still carrying a legacy username/password credential — an app that has switched to a typed client no longer drops out of these numbers.
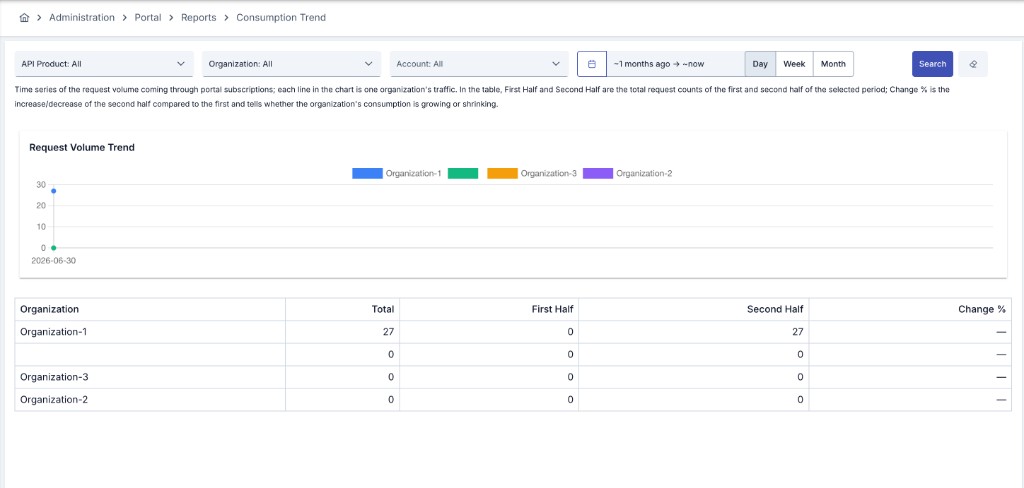
Filtering
| Filter | Description |
|---|---|
| API Product | Narrow the report to one or more API products. If left empty, all products are included. |
| Organization | Narrow the report to one or more organizations. If left empty, all organizations are included. |
| Account | Narrow the report to a specific portal account. |
| Date Range | Set the period using quick shortcuts or a custom start/end date. |
| Interval | Group the time series points by Day, Week, or Month (default: Day). |
How to Read This Report
Each line in the chart shows one organization's request volume over the selected period. The table below shows a per-organization summary:
| Column | Description |
|---|---|
| Organization | Name of the organization whose traffic is shown. |
| Total | Total request count in the selected period. |
| First Half | Total request count in the first half of the period. |
| Second Half | Total request count in the second half of the period. |
| Change % | The increase/decrease of the second half compared to the first half. Left empty when the first half has no traffic, since the percentage cannot be calculated. |
Usage Scenarios:
- Identify an organization whose consumption is growing rapidly and reach out about upgrading to a higher plan.
- Notice an organization with a clearly negative Change % and investigate a potential churn risk early.
- Track how quickly a newly published API product is being adopted across organizations.