Traffic & Usage
What Is It For?
- Shows request, success, blocked, and error summaries by organization / product / application for portal subscriptions
- Surfaces subscriptions approaching quota or rate-limit thresholds
- Helps operations and support triage live issues
- Separates Test and Production so decisions are not made on the wrong environment’s data
- Supports root-cause analysis by opening a request row (without showing secrets) for headers and body
Who Uses It?
- Portal administrators: To watch platform-wide consumption and block rates
- Support / operations: To triage slow or failing calls by organization and app
- Business development: To propose plan upgrades when organizations near quota limits
Access and Permissions
- In the admin panel follow Portal → Reports → Traffic & Usage
- Scope: all organizations of the active portal (cross-org summary)
- The Traffic & Usage tab on an organization overview is the same view scoped to one organization
- Viewing requires roles with portal report access (Portal Manager, Admin, Portal Business)
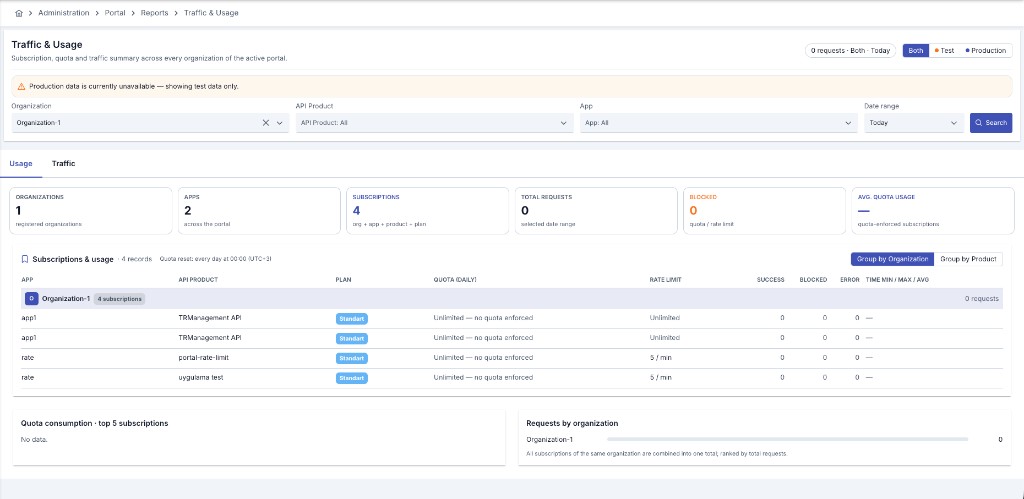
Shared Filters
| Filter | Description |
|---|---|
| Environment | Both · Test · Production — which environment’s data is shown |
| Organization | Narrow to one or more organizations |
| API Product | Narrow by product |
| App | Narrow by application |
| Date range | Last ~1 hour · Today · Last ~7 days · Last ~1 month |
| Search | Refresh the report with the selected filters |
A summary pill shows request count for the selected environment and range.
If Production data cannot be fetched, the screen continues with test data and shows Production data is currently unavailable — showing test data only. Check the environment before deciding.
Usage Tab — How to Read It
Usage is the subscription and quota-oriented summary.
Application traffic here is also attributed to an application whose identity is a typed API Client (client ID matching the traffic row's username/key), not only to one still carrying a legacy username/password credential.
Summary cards
| Card | Meaning |
|---|---|
| Organizations | Organizations matching the filter |
| Apps | Application count |
| Subscriptions | Subscription count |
| Total requests | Total requests in the period |
| Blocked | Requests blocked by quota / rate limit |
| Avg. quota usage | Average quota usage |
Quota alerts show how much of a subscription’s daily limit is used and what remains, in organization · app · product (plan) context.
Subscriptions and usage table
Group by Group by Organization or Group by Product. Rows include app, product or organization, plan, daily quota, rate limit, success / blocked / error, and time (min/max/avg).
- Quota reset: every day at 00:00 (UTC+3)
- Unlimited plans do not enforce quota; pending subscriptions may not show consumption
- Rate limit: Unlimited or per-second / per-minute limits
Panels: top 5 quota-consuming subscriptions and requests by organization.
Traffic Tab — How to Read It
Traffic is the near-live operational view.
| Element | Meaning |
|---|---|
| Refresh | Manual · Every 10s · Every 30s + Refresh |
| KPIs | Total requests · Successful · Blocked · Errored · Success rate · Avg. time |
| Environment split | Test/Sandbox vs Production |
| Charts | Request volume, response time (p50/p95), status code distribution (2xx/4xx/5xx) |
| Most called operations | Busiest operations: operation, product, organization, requests, avg ms, errors |
| API Traffic table | Status, time, endpoint·API key, API, organization·app, product·env, duration |
Status filter: All statuses · Successful (2xx) · Error & blocked
Clicking a row opens a drawer with Request (Client→API) and Response (API→Client) headers/body and correlation id. Credential secrets are never shown.
The table and the dashboards show the traffic of every application owned by an organization you are an active member of — not only the subscriptions you created yourself. Applications that authenticate with an API client (JWT issued for the client id) are matched as well as applications using a legacy credential. Rows of other organizations are never listed and cannot be opened by id.
If Elasticsearch does not respond in time while the log record is being fetched, this drawer does not open with empty fields — a message is shown instead, asking you to try again in a moment. See API Traffic Tab — Detailed View for the exact message and details.
Difference from API Traffic Report
| Traffic & Usage | API Traffic Report |
|---|---|
| Live + quota-oriented dashboard | Date-range summary metrics grid |
| Usage + Traffic tabs | Single summary table |
| Includes App filter | Standalone page has no App filter |
| Operational triage | Period comparison / reporting |
Usage Scenarios
- When an organization’s blocked rate rises, review its quota or rate-limit plan
- When Production p95 degrades, start from the busiest operations
- Separating Test from Production keeps demo/test load from polluting production metrics
- Validate a support ticket by checking the last hour’s Error & blocked rows for that app