Top API Products
What Is It For?
- Ranks the API products that received the most requests through portal subscriptions, together with the distinct organization/app count registered to each product
- Lists published products that received no traffic in the selected period as the Dead Catalog
- Marks each dead-catalog product with a Diagnosis of whether the problem is a subscription or an interest issue
Who Uses It?
- Portal Administrators: To monitor the overall performance of the catalog
- Product Owners: To compare their own products' popularity and take action on unused products
- Business Development Teams: To identify products with showcase visibility that fail to attract subscribers
Screen Access and Permissions
- In the Admin panel's left menu, follow Portal → Reports → Top API Products.
- Only authorized roles (Portal Manager, Admin, Portal Business) can view this report.
Tip
This report ranks products over a period. For live quota/blocks and the request drawer use Traffic & Usage; for product×org×app summary metrics use API Traffic Report.
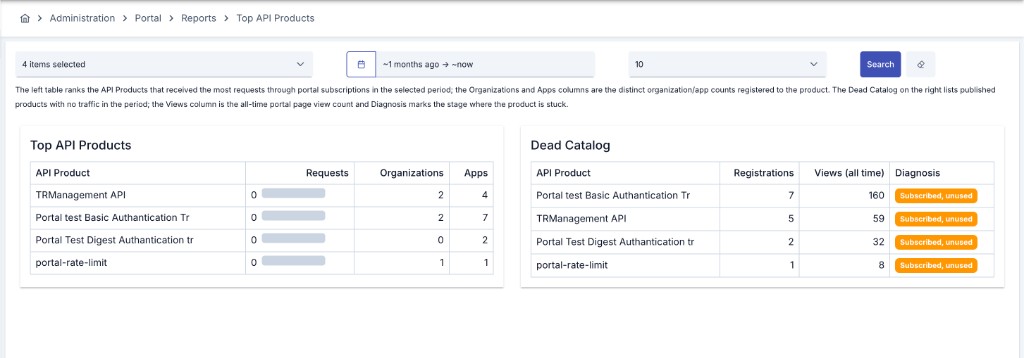
Filtering
| Filter | Description |
|---|---|
| API Product | Narrow the report to one or more API products. If left empty, all products are included. |
| Date Range | Set the period using quick shortcuts or a custom start/end date. |
| Top N | Choose how many products to show in the top-products table: 5, 10, 20, or 50 (default: 10). |
How to Read This Report
The Top API Products table on the left ranks the products that received the most requests in the selected period:
| Column | Description |
|---|---|
| API Product | Name of the product. |
| Requests | Total request count in the selected period. |
| Organizations | Number of distinct organizations registered to the product. |
| Apps | Number of distinct apps registered to the product. |
The Dead Catalog table on the right lists published products that received no traffic in the selected period:
| Column | Description |
|---|---|
| API Product | Name of the product. |
| Registrations | All-time app registration count for the product. |
| Views (all time) | All-time portal showcase page view count for the product. |
| Diagnosis | Marks where the product is stuck: "Subscribed, unused" (has registrations but nobody sends requests), "Interest, no registration" (has views but no registrations), or "No engagement" (neither views nor registrations). |
Usage Scenarios:
- Regularly monitor the top products to report on catalog performance.
- Identify a product diagnosed as "Subscribed, unused" and provide onboarding support to its registered organizations.
- Identify a product diagnosed as "Interest, no registration" and review its product page content or registration flow.