Portal Traffic Report
What Is It For?
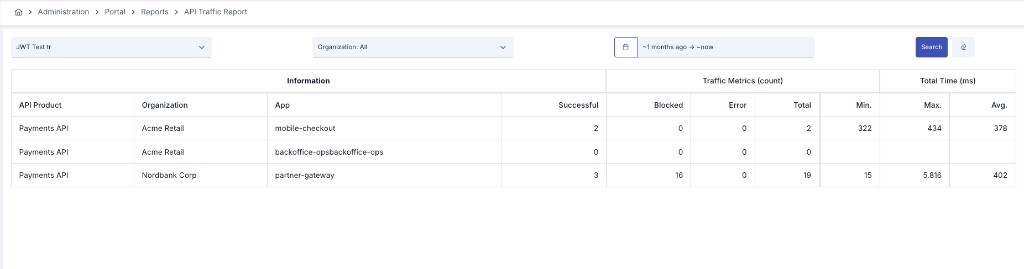
- Summarizes portal subscription traffic by product × organization × application for a selected period
- Places success, blocked, and error counts side by side to show which subscriptions are unhealthy
- Helps you spot slow consumers via min/max/average response times
- Makes period performance comparison and reporting easy without opening the live traffic screen
Who Uses It?
- Portal administrators: To report period subscription performance
- Product owners: To see how their API products are used across organizations
- Support teams: To quickly validate a complaining organization/app pair
Access and Permissions
- In the admin panel follow Portal → Reports → API Traffic Report
- Roles with portal report access (Portal Manager, Admin, Portal Business) can view the report
Info
This screen is not a live request list. It is a summary metrics table for the selected date range. For live quota/traffic and the request drawer, use Traffic & Usage.
Filtering
| Filter | Description |
|---|---|
| API Product | One or more products; empty = all |
| Organization | One or more organizations; empty = all |
| Date range | Analytic date-range picker (default about 30 days) |
| Search / Clear | Run the query / clear filters |
Note
The standalone API Traffic Report page has no App filter. The App filter appears on the traffic panel inside organization overview.
How to Read the Report
Each row is an API Product · Organization · App combination.
Information
| Column | Description |
|---|---|
| API Product | The API product being measured |
| Organization | Consumer organization |
| App | Subscribed application |
Traffic Metrics (count)
| Column | Description |
|---|---|
| Successful | Successful request count |
| Blocked | Requests blocked by quota / rate limit, etc. |
| Error | Failed requests |
| Total | Total requests |
Total Time (ms)
| Column | Description |
|---|---|
| Min. | Lowest response time |
| Max. | Highest response time |
| Avg. | Average response time |
Interpretation tips:
- High Blocked, low Successful → look at quota or rate-limit pressure → Quota / Plan Usage
- High Error → inspect the product, plan, or client integration
- Avg / Max separate outliers; one slow app may skew the average
Usage Scenarios
- Over the last 30 days, see which organizations block the most on a product and review plan limits
- Compare the average duration of a support-reported organization with peers
- Track the first-week success rate of a newly published product