Subscription Funnel
What Is It For?
- Tracks the journey from the portal showcase to real API usage across three stages (Views → App Registration → Active Usage)
- Calculates the conversion rate from one stage to the next and marks the stage with the biggest loss (the bottleneck)
- Provides a per-product breakdown to show which API product fails to convert showcase interest into usage
Who Uses It?
- Portal Administrators: To monitor the overall conversion rate and bottleneck
- Product Owners: To compare how well their own API products convert views into usage
- Business Development Teams: To take action on losses at the registration or first-usage stage
Screen Access and Permissions
- In the Admin panel's left menu, follow Portal → Reports → Subscription Funnel.
- Only authorized roles (Portal Manager, Admin, Portal Business) can view this report.
After subscription, evaluate usage and quota pressure with Traffic & Usage and API Quota / Plan Usage together.
Request counts here attribute traffic to an application whose identity is a typed API Client (client ID matching the traffic row's username/key), not only to one still carrying a legacy username/password credential — an app that has switched to a typed client no longer drops out of these numbers.
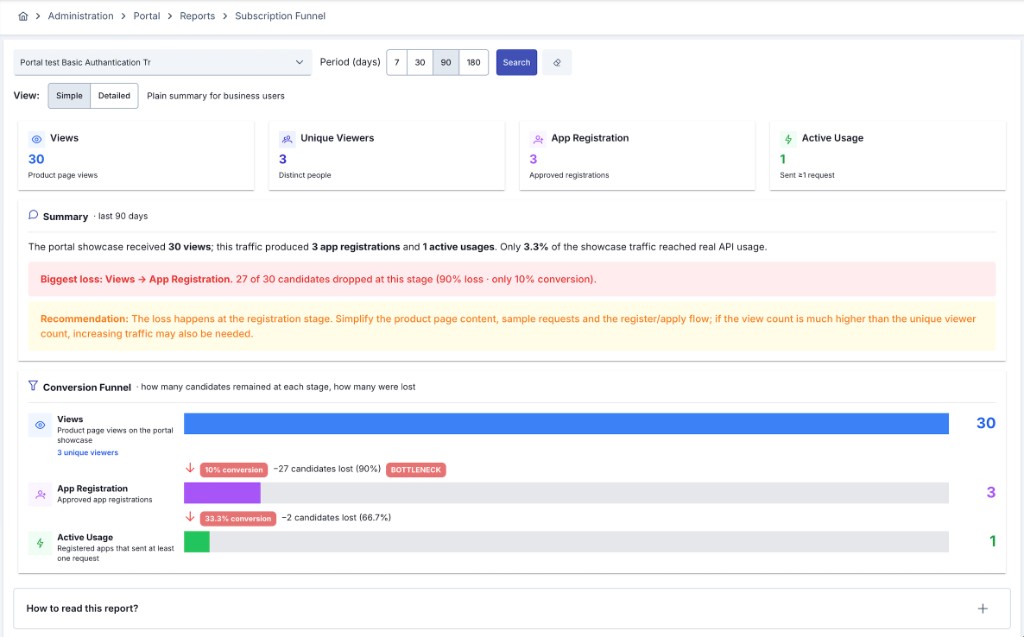
Filtering
| Filter | Description |
|---|---|
| API Product | Narrow the report to one or more API products. If left empty, all products are included. |
| Period (days) | Choose 7, 30, 90, or 180 days (default: 90 days). |
| View | Switch between Simple (a plain summary for business users) and Detailed (includes product breakdown and definitions). |
How to Read This Report
The funnel has three stages:
| Stage | Description |
|---|---|
| Views | Product page views on the portal showcase in the selected period. The unique viewer count is also shown; high views with a low unique-viewer count means a few people are visiting the page many times. |
| App Registration | App registrations approved in the period. |
| Active Usage | Registered apps that sent at least one request in the period. |
Conversion rates are always calculated relative to the previous stage (e.g. Views-to-Registration conversion = Registrations ÷ Views). The Bottleneck marks the stage with the lowest conversion — i.e. where most candidates are lost; it is colored red below 40%, orange between 40-80%, and green above 80%.
At the top of the page, a summary insight shows the total views/registrations/usages for the period, the overall conversion rate, and a recommendation specific to the stage with the biggest loss (simplifying the product page/registration flow if the loss is at registration, or reviewing onboarding documentation if the loss is at first usage).
In Detailed view, a per-product breakdown table is added:
| Column | Description |
|---|---|
| API Product | Name of the product. |
| Views / Registrations / Usage | The product's view, registration, and active-usage counts. |
| View→Reg. / Reg.→Usage | The product's conversion rates. |
| Bottleneck | The stage where the product loses the most candidates. |
Usage Scenarios:
- Identify which stage the overall funnel is stuck at and plan a targeted action (e.g. simplifying the registration form, improving onboarding documentation).
- Compare the per-product breakdown in Detailed view to identify products that fail to convert showcase interest into usage.
- Vary the period length (7/30/90/180 days) to separate short-term campaign impact from long-term trends.