API Quota / Plan Usage
What Is It For?
- Compares the plan limit against the consumption in the active quota window for every approved subscription
- Highlights subscriptions carrying a limit risk (90% and above) or that should be watched (70-90%)
- Flags subscriptions with consistently high consumption as upsell candidates
- Breaks down an organization's quota consumption by account → app → credential
Who Uses It?
- Portal Administrators: To catch subscriptions carrying a limit risk early
- Business Development / Sales Teams: To identify subscriptions that are good candidates for an upsell to a higher plan
- Support Teams: To inspect an organization's quota consumption at the account/app/credential level
Screen Access and Permissions
- In the Admin panel's left menu, follow Portal → Reports → Quota / Plan Usage.
- Only authorized roles (Portal Manager, Admin, Portal Business) can view this report.
For live quota consumption and traffic, use Traffic & Usage.
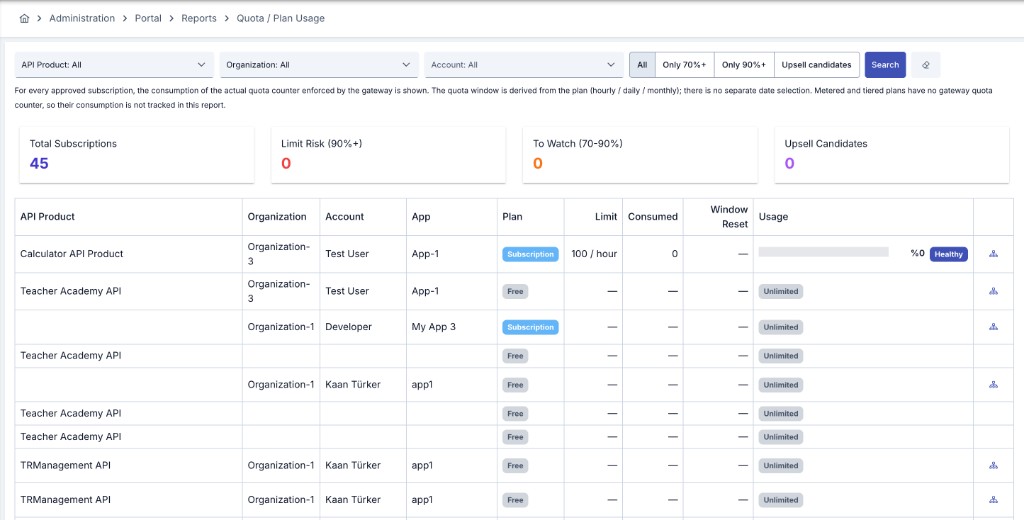
The quota window is derived directly from the plan's defined interval (hourly / daily / monthly), not from a separate date selection — so this report has no date range filter.
Metered and tiered plans have no gateway quota counter, so consumption for those subscription types cannot be tracked in this report.
The plan's quota and rate limit govern every application subscribed to it, regardless of whether its identity is a typed API Client or a legacy username/password credential (including a consumer migrated from one) — coverage is no longer limited to typed-client applications only.
Filtering
| Filter | Description |
|---|---|
| API Product | Narrow the report to one or more API products. If left empty, all products are included. |
| Organization | Narrow the report to one or more organizations. If left empty, all organizations are included. |
| Account | Narrow the report to a specific portal account. |
| Show | Narrow the table to All, Only 70%+, Only 90%+, or Upsell candidates. |
How to Read This Report
The summary cards at the top show:
| KPI Card | Description |
|---|---|
| Total Subscriptions | Number of approved subscriptions matching the filter. |
| Limit Risk (90%+) | Number of subscriptions whose active-window consumption has reached or exceeded 90% of the limit. |
| To Watch (70-90%) | Number of subscriptions whose consumption is in the 70-90% range. |
| Upsell Candidates | Number of subscriptions whose consumption stayed at or above 85% for the last two closed quota windows, making them candidates for an upgrade. |
Table columns:
| Column | Description |
|---|---|
| API Product | The API product the subscription belongs to. |
| Organization / Account / App | The organization, account and app that own the subscription. |
| Plan | The subscription plan type: Free, Subscription, Metered, or Tiered. |
| Limit | The plan's defined quota limit; left empty for unlimited plans. |
| Consumed | Requests consumed in the active quota window; left empty for metered/tiered plans since no counter is kept. |
| Window Reset | When the active quota window resets. |
| Usage | Consumption as a percentage of the limit; colored below 70% normal, 70-90% to watch, 90% and above limit risk. |
The "Organization quota detail" button on an organization row opens a detail screen showing that organization's account → app → credential breakdown and each credential's consumption in the active quota window.
When a subscription's consumption never increases, the product's proxy may not be identifying the consumer: if the proxy has no active consumer-identifying authentication policy (the policy was left inactive, there is none, or an Apinizer-issued token is verified by signature only), requests count as anonymous, the quota counter never moves and no 429 is returned on overage. How to check and fix it: Authentication required for plan limits to apply.
Usage Scenarios:
- Identify a subscription carrying a limit risk and start a conversation with the organization about upgrading to a higher plan.
- Regularly report subscriptions flagged as upsell candidates to the sales team.
- When an organization complains about capacity, use the detail screen to find which credential is filling up its quota window.