API Error / Block Analysis
What Is It For?
- Shows successful / erroneous / blocked request counts and the error rate per organization
- Lists the most frequent HTTP status codes (Dominant Status Codes) per organization for the selected period
- Lets you compare overall platform health and identify which organizations experience more errors/blocks
Who Uses It?
- Portal Administrators: To monitor changes in the overall error/block rate
- Support Teams: To diagnose what kind of errors/blocks a complaining organization's traffic is experiencing
- Product Owners: To see how widespread integration issues tied to an API product are across organizations
Screen Access and Permissions
- In the Admin panel's left menu, follow Portal → Reports → Error / Block Analysis.
- Only authorized roles (Portal Manager, Admin, Portal Business) can view this report.
Tip
For live quota/blocks and the request drawer use Traffic & Usage; for product×org×app summary metrics use API Traffic Report.
Info
Request counts here attribute traffic to an application whose identity is a typed API Client (client ID matching the traffic row's username/key), not only to one still carrying a legacy username/password credential — an app that has switched to a typed client no longer drops out of these numbers.
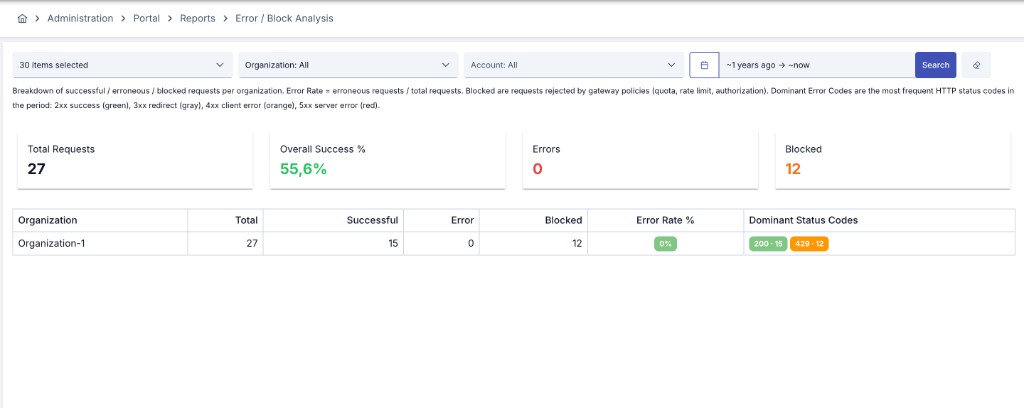
Filtering
| Filter | Description |
|---|---|
| API Product | Narrow the report to one or more API products. If left empty, all products are included. |
| Organization | Narrow the report to one or more organizations. If left empty, all organizations are included. |
| Account | Narrow the report to a specific portal account. |
| Date Range | Set the period using quick shortcuts or a custom start/end date. |
How to Read This Report
The summary cards at the top show platform-wide totals for the selected period:
| KPI Card | Description |
|---|---|
| Total Requests | Total request count in the selected period. |
| Overall Success % | Ratio of successful requests to total requests. |
| Errors | Total number of requests that resulted in an error. |
| Blocked | Total number of requests rejected by gateway policies (quota, rate limit, authorization). |
The table below shows the per-organization breakdown:
| Column | Description |
|---|---|
| Organization | Name of the organization whose traffic is shown. |
| Total | Total request count for the organization. |
| Successful | Number of requests that completed successfully. |
| Error | Number of requests that resulted in an error. |
| Blocked | Number of requests rejected by gateway policies. |
| Error Rate % | Ratio of erroneous requests to total requests. |
| Dominant Status Codes | The most frequent HTTP status codes in the period, color-coded: 2xx success (green), 3xx redirect (gray), 4xx client error (orange), 5xx server error (red). |
Usage Scenarios:
- Identify an organization whose error rate is clearly above average and route it to the support team.
- Notice an organization with a high blocked request count and recognize that its quota or rate-limit plan is insufficient.
- Use the dominant status codes to distinguish whether an integration issue is authentication-related (4xx) or infrastructure-related (5xx).