Environment Diagnostics
Diagnostics Overview
The Diagnostics page allows you to monitor system health, performance, and resource usage of Gateway Runtime and Cache Server environments. Through this page, you can view pod status, JVM metrics, thread information, and module-specific metrics.
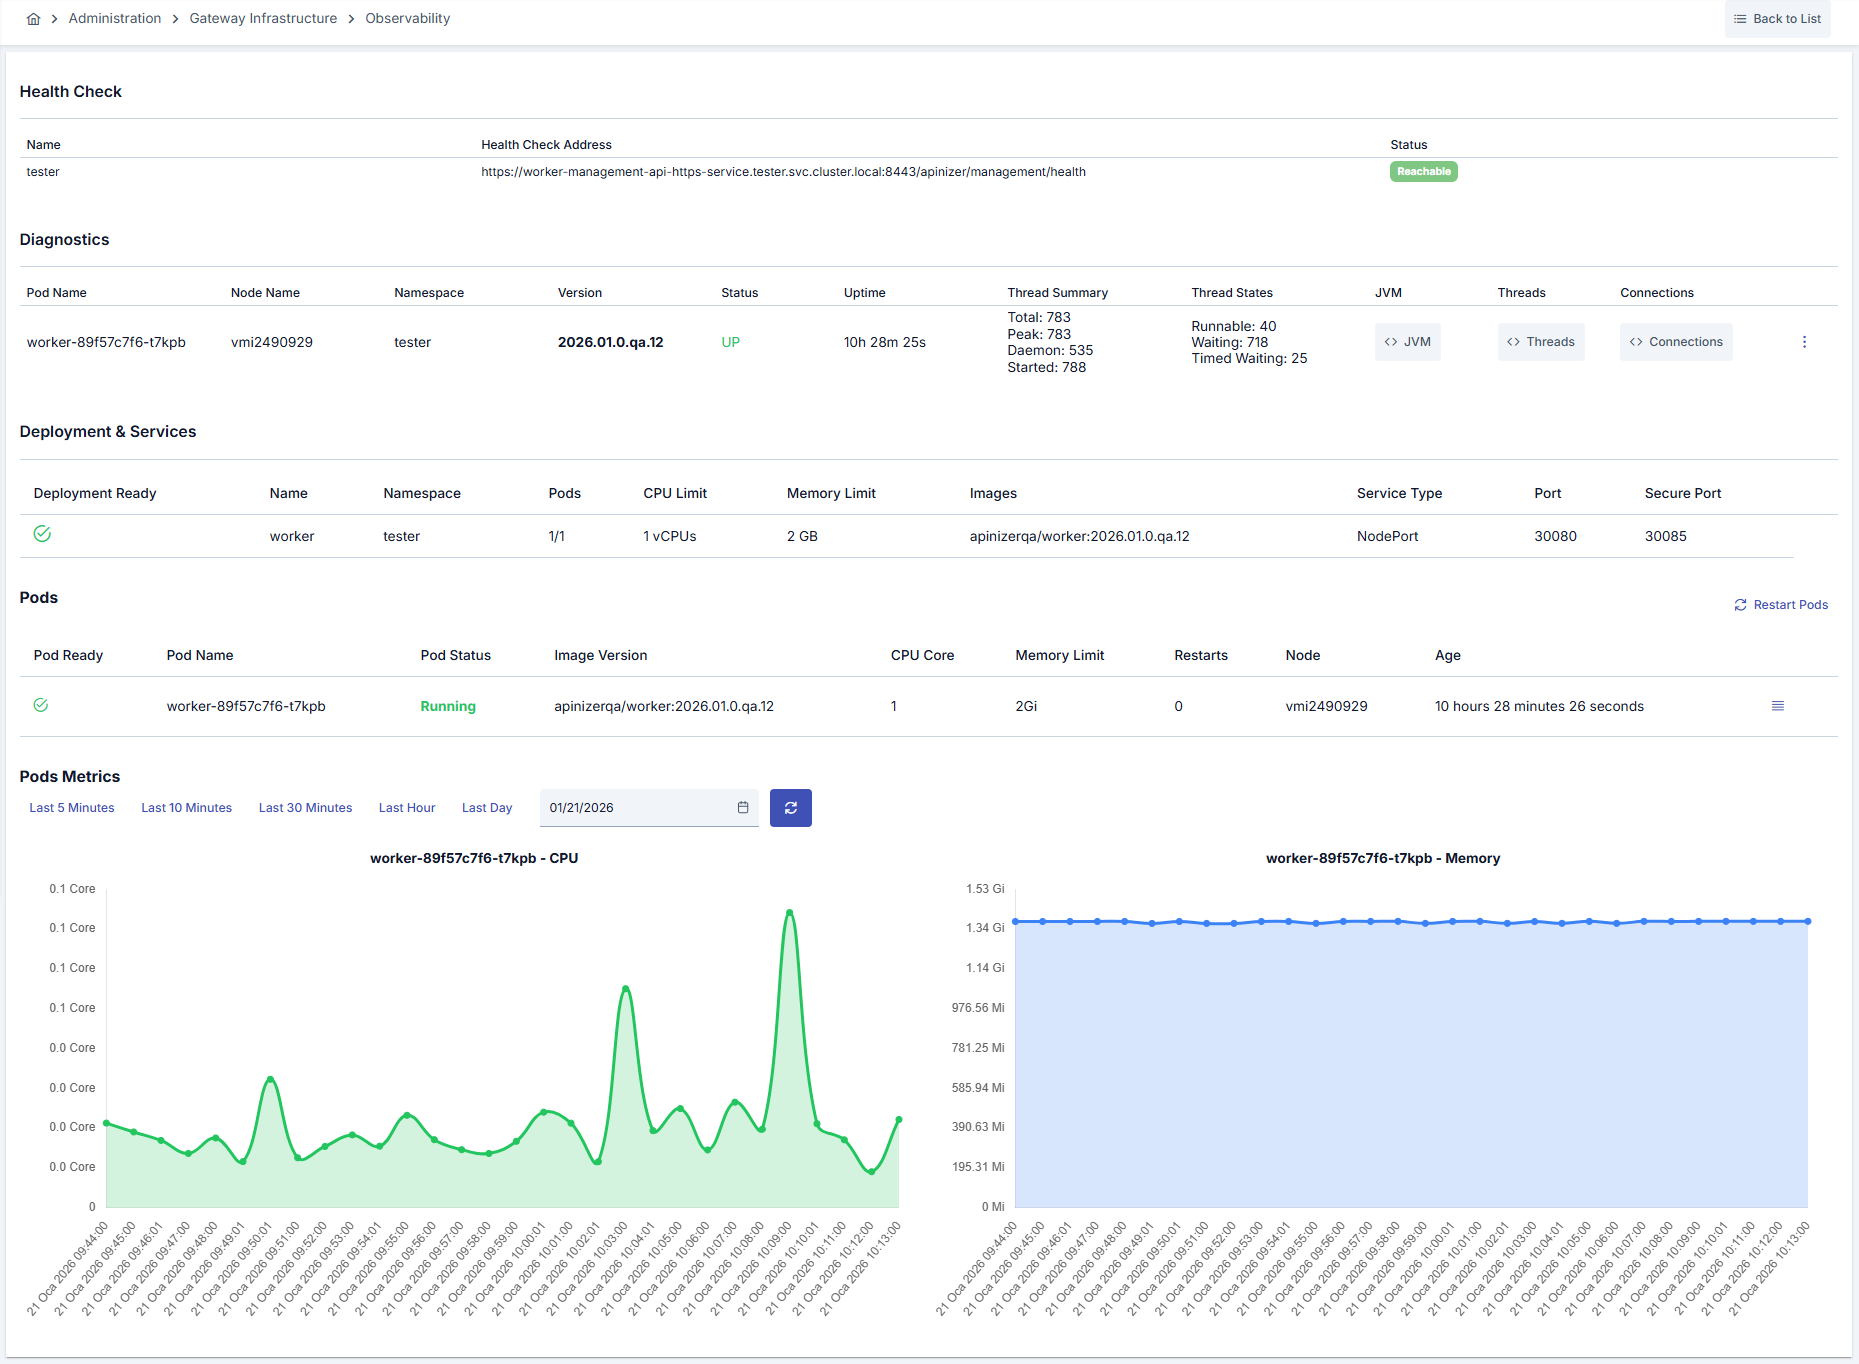
Health Check
You can check the status of Management API endpoints. For each endpoint:
- API Settings Name: Name of the endpoint configuration
- Health Check Address: Health check address
- Status: Endpoint accessibility status (Reachable/Not Reachable)
- Gateway Runtime: Management API endpoints are checked
- Cache Server: Cache Management API endpoints are checked
Diagnostics Table
The Diagnostics table displays the following information:
| Field | Description |
|---|---|
| Pod Name | Name of the pod |
| Node Name | Name of the Kubernetes node where the pod is running |
| Namespace | Namespace where the pod is located |
| Version | Apinizer version running on the pod |
| Status | Health status of the pod (UP/DOWN) |
| Uptime | Pod uptime |
| Thread Summary | Thread summary information (Total, Peak, Daemon, Started) |
| Thread States | Thread states (Runnable, Waiting, Timed Waiting) |
| JVM | Button to view JVM metrics |
| Threads | Button to view thread details |
| Connections | Button to view connection pool information (Gateway Runtime only) |
| Hazelcast | Button to view Hazelcast cluster metrics (Cache Server only) |
Detailed Metric Viewing
You can access detailed metric information in JSON format by clicking the buttons in the Diagnostics table:
Common Metrics
- JVM Metrics: Memory usage, heap/non-heap information, garbage collection statistics
- Thread Details: States and stack trace information of all threads
Gateway Runtime Specific Metrics
- Connection Pool Information: HTTP connection pool status and statistics
The Gateway Runtime Diagnostics page contains JVM, Threads, and Connections buttons.
Cache Server Specific Metrics
- Hazelcast Metrics: Hazelcast cluster information, cache statistics, distributed map metrics
Hazelcast Metrics:
Hazelcast metrics are only available in the Cache Server module and show the detailed status of the Hazelcast cluster. Cluster member information, cache statistics, and distributed map metrics can be viewed from this section.
The Cache Server Diagnostics page contains JVM, Threads, and Hazelcast buttons.
Pod Log Viewing
You can view pod logs by selecting Show Log from the menu in the Diagnostics table. A log viewing window opens and displays the pod's log content.
Pod Deletion
You can delete a pod by selecting Delete from the menu in the Diagnostics table. When a pod is deleted, Kubernetes automatically creates a new pod.
Deployment & Services Information
For managed mode, the following information is displayed:
- Deployment Ready: Deployment readiness status
- Deployment Name: Name of the deployment
- Namespace: Namespace information
- Pods: Ready pod count / Total replica count
- CPU Limit: CPU limit value
- Memory Limit: Memory limit value
- Image Version: Image version used
- Service Type: Service type
- Port: HTTP service port
- Secure Port: HTTPS service port (Gateway Runtime only)
Secure Port: HTTPS service port information is displayed for Gateway Runtime environments. This information is not available for Cache Server environments.
Pod Metrics
You can view CPU and memory usage of pods over time as graphs:
- Time Range Selection: Last 5 minutes, 10 minutes, 30 minutes, 1 hour, or 1 day
- Date Selection: You can select a custom date range
- CPU Graph: Area graph showing pod CPU usage
- Memory Graph: Area graph showing pod memory usage
Accessing the Diagnostics Page
To access the Diagnostics page:
- Gateway Runtime: Click the Diagnostics button of the relevant Gateway Runtime environment from the Gateway Runtimes page
- Cache Server: Click the Diagnostics button of the relevant Cache Server from the Distributed Cache page
For more information about Diagnostics endpoints, see the Diagnostic Endpoint Addresses page.