Elasticsearch
Overview
What is its Purpose?
Connection transmits log, metric, and search data from Integration Flow or Connector steps to a central Elasticsearch cluster.
Manages REST requests with high availability through multiple host (HTTP/HTTPS) definitions.
Standardizes cluster governance through Index Template and Index Lifecycle Policy (ILM) automation.
Triggers maintenance tasks such as rollover, template creation, and policy synchronization with a single click.
Working Principle
When an Elasticsearch Connection is requested from within an Integration Flow or Connector, the system reads the configured connection parameters.
The HTTP client uses a fixed-size connection pool per host (20 connections per host; the total limit scales with the number of configured hosts). These values are not user-configurable.
When Basic Authentication is provided, username/password are sent; otherwise, anonymous access or IP-based security is used.
JSON-bodied CRUD requests are sent to REST endpoints over HTTP/HTTPS; socket settings (keep-alive, reuse) ensure transmission continuity.
When the operation completes, the connection returns to the pool, and open sockets close when keep-alive periods expire.
On connection error, timeout, or authentication error, Apinizer Message Service generates notifications; details are shown in the deployment result dialog.
Usage Areas
Writing Gateway logs to central Elasticsearch indices
Accessing read-only clusters for search/reporting purposes
Managing high-volume log clusters requiring ILM and template automation
Routing traffic to disaster recovery or geo-redundant Elasticsearch clusters
Technical Features and Capabilities
Basic Features
Provides load distribution among cluster nodes through HTTP/HTTPS scheme, host, and port combinations.
Shard/replica counts and refresh interval values are managed through the UI.
When the Administrate option is enabled, Index Template, ILM Policy creation, and rollover trigger buttons become active. The connection list shows status indicators for ILM Policy, Index Template, and Data Stream, along with a Live Check button that queries this status directly from Elasticsearch.
Ability to define separate connection parameters for each environment (Development, Test, Production).
Activating or deactivating the connection (enable/disable toggle). In passive state, the connection cannot be used but its configuration is preserved.
Advanced Features
Age, size, and replication thresholds for Hot/Warm/Cold/Delete phases are controlled through a modal.
SSL/TLS communication is secured by uploading PKCS#12 or PEM-based CA/keystore files.
In READ_WRITE mode, administrative operations are active; in READ mode, only queries are performed.
Ability to validate connection parameters before saving using the "Test Connection" button.
Exporting connection configuration as a ZIP file. Importing to different environments (Development, Test, Production). Version control and backup capability.
Monitoring connection health, pool status, and performance metrics.
Connection Parameters
Required Parameters
Description: Connection name (must be unique)
Example Value: Production_ElasticLog
Notes: Cannot start with a space, special characters should not be used
Description: Index name where logs will be written
Example Value: apinizer-log-apiproxy-default
Notes: Automatically created when Administrate is enabled; conflicts are checked
Description: Scheme/host/port for each host
Example Value: HTTPS : es-prod-01 : 9243
Notes: At least one host is required; host and port fields cannot be left empty
Description: Single value used for connection establishment, response wait, and pool checkout time
Example Value: 5000
Notes: Default 5000; the UI only enforces that the field is filled (no min/max). See "Timeout Behavior" below for details.
Description: READ_WRITE or READ mode
Example Value: READ_WRITE
Notes: If READ is selected, administrate is disabled
Optional Parameters
Description: Connection purpose description
Default Value: Empty
Recommended Value: Short text containing operational information
Description: Basic Authentication on/off
Default Value: false
Recommended Value: true based on requirements in Production
Description: Username
Default Value: Empty
Recommended Value: Required if Authentication is active
Description: Password
Default Value: Empty
Recommended Value: Should be entered through secret manager
Description: Template/ILM management
Default Value: true (READ_WRITE)
Recommended Value: Can be closed if external team manages
Description: TLS hostname verification
Default Value: true
Recommended Value: Change to false in Production
Timeout Behavior and Fixed Connection Pool Settings
Connection Timeout is a single value used for three different purposes. There is no separate "Request Timeout" field. The Connection Timeout (ms) value you enter is applied on the gateway side, at the same time, to all three of the following:
- Connection establishment (connect) time
- Waiting for the Elasticsearch response (response) time
- Time to obtain a connection from the pool (connection request) time
Values below 1000 ms fall to 0 on the server side due to integer division (ms / 1000), and automatically fall back to the default of 5 seconds (5000 ms). This is not a validation rule — it is a side effect of the division. The UI has no min/max validation for this field, only a required check.
Description: Single value used for connect + response wait + pool checkout
Default: 5000
Unit: milliseconds
Notes: The UI only enforces that the field is filled; no min/max. Values below 1000 ms fall back to 5000 ms.
Description: Concurrent connections per host
Value: 20 (fixed)
Total Limit: 20 × number of configured hosts
Notes: Not user-configurable
Description: Threshold after which an idle pooled connection is re-validated before reuse
Value: 10 seconds (fixed)
Notes: Not user-configurable
Description: Maximum time a connection can stay in the pool
Value: 3 minutes (fixed)
Notes: Keep-alive strategy is 30 seconds; neither is user-configurable
Parameters Only Configurable via APIops
The following three fields do not appear in the Connection UI form; they can only be set through APIops (Connection DTO), and they govern the behavior of the asynchronous log-writing queue:
| Parameter | Description | Default |
|---|---|---|
| bulkBufferCapacity | Capacity of the asynchronous write queue (in-memory ArrayBlockingQueue) | 50000 |
| bulkFlushIntervalMs | How often the queue is flushed to Elasticsearch | 100 (ms) |
| bulkMaxBatchSize | Maximum number of records sent in a single _bulk call | 2500 |
Asynchronous Write and Failover Behavior
The Elasticsearch connection does not block the request thread while writing logs; writes are fully asynchronous:
- The
index*methods place the record into an in-memory queue (ArrayBlockingQueue) whose capacity isbulkBufferCapacity, then return immediately — the thread handling the request does not wait for a response from Elasticsearch. - Records in the queue are sent to Elasticsearch by a separate scheduled thread pool (thread names start with
es-bulk-flusher-) everybulkFlushIntervalMsmilliseconds, via_bulkcalls of at mostbulkMaxBatchSizerecords each. - This flusher only starts in the Worker process. There is no asynchronous log writing in the Manager process; the Manager's Elasticsearch calls (report/query screens) are entirely synchronous, and Connection Timeout directly bounds those queries.
- As a result, Connection Timeout does not bind the request thread that writes logs — it bounds the flusher thread on the Worker, or the report query on the Manager.
- Failover: If a bulk call fails for any reason (connection failure, response timeout, queue full, etc.), the record is automatically sent to the configured failover connector. Failover is triggered on any type of error, including timeouts — not only when a connection cannot be established at all.
Usage Scenarios
Situation: Millions of log entries per minute
Solution: READ_WRITE, administrate enabled, ILM rollover thresholds kept tight
Expected Behavior: ILM automatically performs rollover; records are written as background (asynchronous) bulk batches on the Worker — the request thread never waits on Elasticsearch
Situation: Read-only queries
Solution: READ, administrate disabled, authentication=true
Expected Behavior: Cluster only receives queries, management operations are blocked
Situation: Two data centers
Solution: Two HTTPS hosts, encrypt communication + PKCS#12 CA
Expected Behavior: Traffic automatically routes to healthy host
Situation: New fields added
Solution: Update template name and shard/replica, then run "Create Index Template"
Expected Behavior: New indices open with current schema
Situation: Logs older than 90 days will be deleted
Solution: ILM delete phase active, minAgeOfDelete=90
Expected Behavior: Old indices are automatically cleaned
Situation: TLS required, internal CA
Solution: Encrypt communication enabled, CA_IN_PEM_FILE uploaded
Expected Behavior: Secure connection established with certificates
Connection Configuration
Creating a New Elasticsearch Connection
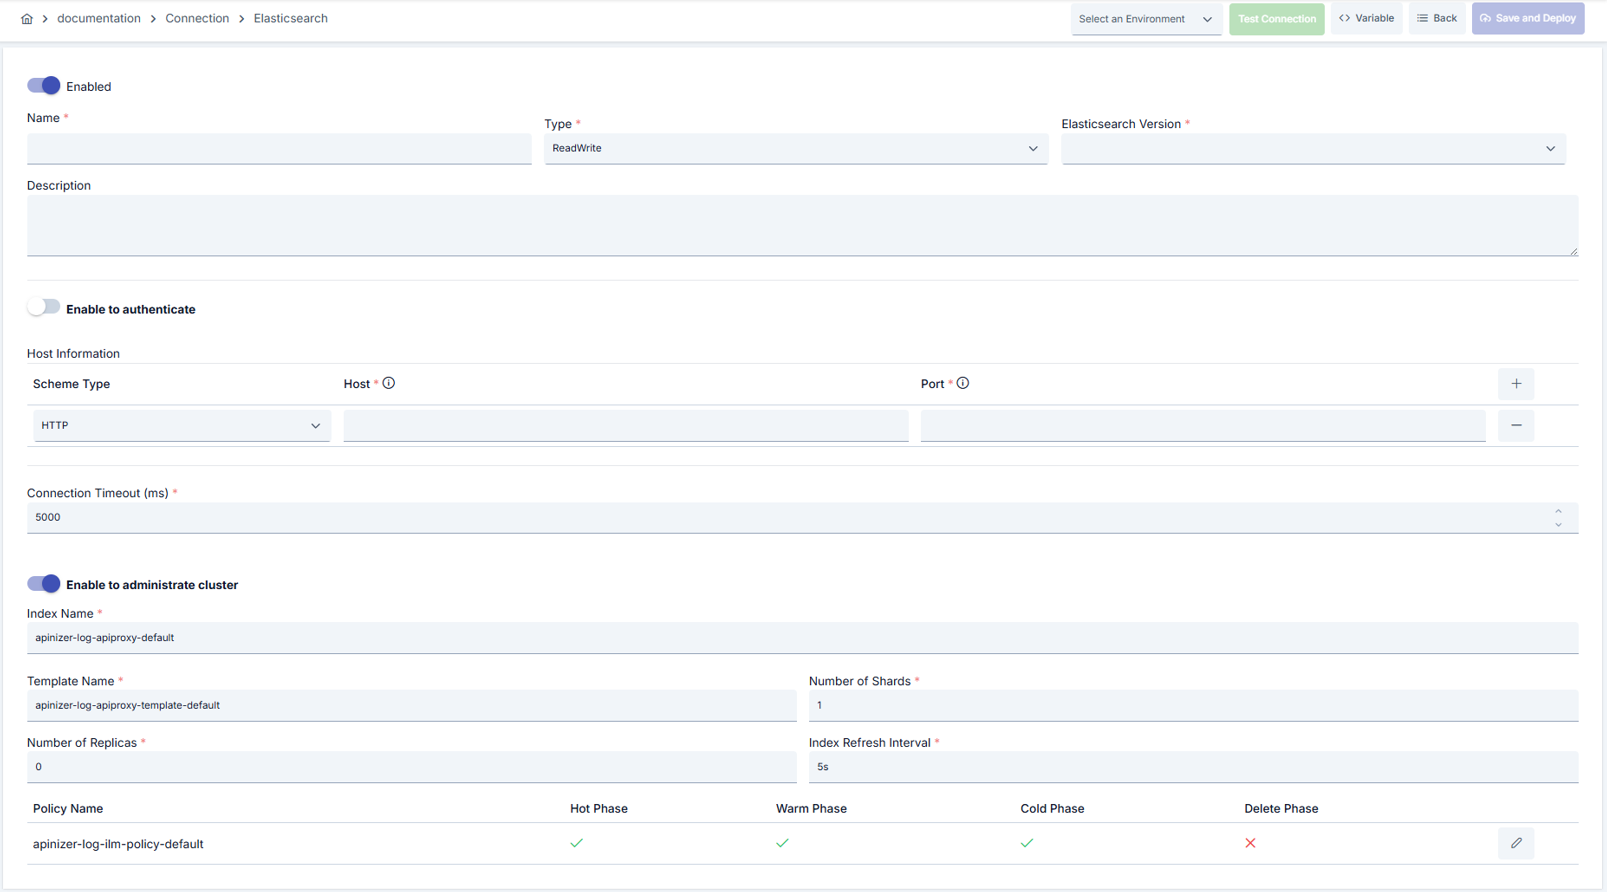
Configuration Steps
- Go to Connection → Elasticsearch from the left menu.
- Click the [+ Create] button in the top right.
- The new Elasticsearch Connection creation form opens.
Enable Status (Active Status) Setting:
- Find the Enable Status toggle at the top of the form.
- Set the toggle to Active position (defaults to active).
- If you want to make the connection passive, set the toggle to Passive position.
- Passive connections cannot be used in Integration Flows but their configurations are preserved.
Name (Name) - Required Field:
- Enter a unique connection name in the Name field.
- Name examples:
`Production_ElasticLog`,`Test_ElasticConnection`,`Dev_ElasticSearch` - Naming rules:
- Cannot start with a space
- Special characters should not be used (recommended: letters, numbers, underscore)
- Maximum 255 characters
- The system automatically checks as you type:
- Green checkmark: Name is available
- Red X mark: Name already exists, choose a different name
Description (Description) - Optional:
- Enter text describing the connection's purpose in the Description field.
- Example descriptions:
- "Writes Gateway logs to production cluster"
- "Production environment Elasticsearch connection"
- "Dummy Elasticsearch connection for test environment"
- Maximum 1000 character limit.
- This field can be left empty.
In the action button area at the top of the page, you can use the [<> Variable] button to select dynamic values, and with global variables, you can manage connection parameters with variable-based values instead of fixed values. For detailed information, review the Dynamic Variables page.
- Find the Environment dropdown menu.
- Open the dropdown menu and select one of the following options:
- Development: For development environment
- Test: For test environment
- Production: For production environment
- Different connection parameters can be defined for each environment.
- Environment selection determines in which environment the connection will be active.
- Connections with the same name can be created separately for different environments.
You can provide high availability by adding multiple hosts.
Scheme Selection:
- Select Scheme for each host: HTTP or HTTPS
- When HTTPS is selected, Encrypt Communication automatically opens.
Host/Port - Required:
- Enter the Elasticsearch node's address in the Host field.
- Enter the port number in the Port field (default: 9200).
- Host format:
- FQDN (Fully Qualified Domain Name):
`es-prod-01.company.com` - IP address:
`192.168.1.100` - Add multiple hosts to backup cluster access.
- At least one host is required.
Connection Type Selection:
- Select from the Connection Type dropdown menu:
- READ_WRITE: For read and write operations (administrative operations active)
- READ: For read-only operations (administrate disabled)
- Connection type selection determines administrate behavior.
Index Name - Required:
- Enter the index name where logs will be written in the Index Name field.
- Example:
`apinizer-log-apiproxy-default` - Automatically created when Administrate is enabled; conflicts are checked.
Administrate Setting:
- Find the Administrate toggle.
- Set the toggle to Active position for template and ILM management.
- When Administrate is active, the following fields become visible:
- Template name (default:
apinizer-log-apiproxy-template-default) - Shard count (default: 1)
- Replica count (default: 0)
- Refresh interval (default:
5s) - Preference for loading fixed bitset filters eagerly (enabled by default). Turning it off lowers heap usage on the Elasticsearch nodes. It is a static index setting: it applies only to new indices; after saving, run Create Index Template and wait for the next rollover.
- The
bulkBufferCapacity,bulkFlushIntervalMs, andbulkMaxBatchSizefields do not appear in this UI form; they can only be set through APIops.
ILM Policy Configuration:
- Click the Edit ILM Policy button.
- Set hot/warm/cold/delete phase thresholds in the opened modal.
- Verify that the policy name is unique.
- Check the policy name before the first deployment.
Data Stream Creation:
- Once ILM Policy and Index Template have been created successfully, the data stream for the index name is created automatically during Save and Deploy.
- If the data stream already exists, creation is not attempted again.
- If creation fails, the error detail is shown in the deploy result dialog.
Connection Timeout:
- Enter the value in the Connection Timeout (ms) field.
- Default: 5000 milliseconds
- This single value is used simultaneously for connection establishment, waiting for the Elasticsearch response, and obtaining a connection from the pool. There is no separate "Request Timeout" field.
- The UI only enforces that this field is filled (no min/max validation). Values below 1000 ms fall back to 5000 ms (5 seconds) automatically on the server side due to integer division.
Connection pool size (20 connections per host) and idle-connection settings (validate-after-inactivity, TTL, keep-alive) are fixed and cannot be configured from the screen.
Authentication Setting:
- Find the Authenticate toggle.
- If your Elasticsearch cluster requires authentication, set the toggle to Active position.
- Most production environments require authentication.
Username and Password:
- When the Authenticate toggle is active, the Elastic Username field becomes visible.
- Enter the Elasticsearch username.
- Enter the password in the Elastic Password field.
- The password will appear masked for security reasons.
- Use of secret manager is recommended for sensitive information.
Encrypt Communication (TLS):
- When at least one host has HTTPS selected, the Encrypt Communication section becomes visible.
- Select TLS type:
- PKCS#12 CA: CA file in PKCS#12 format
- PEM CA: CA file in PEM format
- PKCS#12 cert+key: Certificate and key file in PKCS#12 format
- Upload the required files.
- Forms with missing files will error and not allow saving.
Disable Hostname Verification:
- Find the Disable Hostname Verification toggle.
- Change to false in Production (default: true).
- Can be left as true in test environment.
Always use SSL/TLS in production environment and keep hostname verification active.
- Find the [Test Connection] button at the bottom of the form or in the top right corner.
- Click the button.
- The system tests the connection parameters:
- Connection is established to Elasticsearch cluster
- Authentication is performed (if Authentication is active)
- TLS handshake is performed (if Encrypt Communication is active)
- Cluster health is checked
- Test result:
- Successful: Green confirmation message is displayed, such as "Connection test successful"
- Failed: Red error message is displayed, error details are shown
- In case of error:
- Read the error message
- Check relevant parameters (Host, Port, Username, Password)
- Check firewall and network settings
- Check Elasticsearch cluster health
- Fix parameters and test again until test is successful.
- Ensure all required fields are filled.
- Verify that test connection is successful (recommended).
- Click the [Save and Deploy] button in the top right corner of the form.
- The system saves the connection and deploys it to the selected environment.
- After successful save:
- You are redirected to the connection list page
- New connection appears in the list
- Connection becomes Enabled
- Becomes available for use in Integration Flow and Connector steps
Checklist (Before Saving):
- Name field is unique and valid
- At least one Host and Port fields are filled
- Index Name is filled
- Connection Type is selected
- If Authentication is active, Username and Password are filled
- Environment is selected
- Test Connection is successful (recommended)
- All required fields are filled
Result:
- Connection is successfully created and saved
- Becomes active in the selected environment
- Connection selection can be made in Integration Flow and Connector steps
- Appears in connection list and can be managed
Connection successfully created! You can now use it in Integration Flow and Connector steps.
Status Indicators and Live Check in the Connection List
For connections where Administrate is enabled and Connection Type is READ_WRITE, the connection list displays three status indicators. Each row also has a Live Check button, independent of the Administrate setting.
Visible for connections with Administrate enabled and Connection Type set to READ_WRITE. Green check: the policy exists on Elasticsearch; red: it does not. Click the indicator to attempt creating it again.
Visible for connections with Administrate enabled and Connection Type set to READ_WRITE. Green check: the template exists on Elasticsearch; red: it does not. Click the indicator to attempt creating it again.
Visible for connections with Administrate enabled and Connection Type set to READ_WRITE. Green check: the data stream exists on Elasticsearch; red: it does not. Unlike the ILM Policy and Index Template indicators, this one cannot be clicked to trigger creation directly; once ILM Policy and Index Template are ready, the data stream is created automatically during Save and Deploy.
A refresh icon shown on every row of the connection list. Clicking it queries, in real time, whether the ILM Policy, Index Template, and Data Stream actually exist on the Elasticsearch cluster; the connection record is updated with this real status, and the last check time is displayed below the button.
If the cluster cannot be asked during Live Check (unreachable, timeout, or a credential error), the three indicators switch to an orange question mark instead of turning red. The saved "created" values are kept, the tooltip shows when the failed check ran, and the toast carries the reason. "Not found" (a real 404 from Elasticsearch) is the only answer that turns an indicator red; a cluster that is down never overwrites a verified green. Run Live Check again once the cluster is reachable.
Before Live Check runs, the indicators only reflect Apinizer's own saved record. If a connection is repointed to a different Elasticsearch cluster, the old status may keep showing on screen; run Live Check to see the current status.
Live Check cannot be run while the connection is passive (Disabled); a warning message is shown when the button is clicked.
If the check cannot complete (for example, the cluster is unreachable), an error message is shown, but the saved indicators and the last check time are not changed. Being unreachable is not treated as "does not exist" — a temporary outage does not overwrite a known-good status.
Deleting Connection
Select Delete from the ⋮ menu at the end of the row or click the [Delete] button on the connection detail page
Check Before Deleting: May be in use in Integration Flow or Connector steps. If necessary, assign an alternative connection. Take a backup with Export before deleting
Instead of deleting, use the Disable option. Connection becomes passive but is not deleted. Can be reactivated when needed
Exporting/Importing Connection
In this step, users can export (export) existing connections for backup, moving to different environments, or sharing purposes, or import (import) a previously exported connection again. This operation is used to maintain data integrity in version control, transitions between test and production environments, or inter-team sharing processes.
Export
Click the [Export] button on the connection detail page. ZIP file is downloaded.
The row's ⋮ menu now has two items: the primary Export opens the Export/Import Wizard with this connection preselected — any ${VARIABLE} reference in its host, URL or password field surfaces automatically on the dependency step; the secondary Export as File downloads the ZIP described below directly, without going through the wizard.
Format: Date-connection-ConnectionName-export.zip
Example: 13 Nov 2025-connection-Production_ElasticLog-export.zip
- Connection JSON file
- Metadata information
- Dependency information (e.g., certificates, key store)
- Backup
- Moving between environments (Test → Prod)
- Versioning
- Team or project-based sharing
Import
- Click [Import Elasticsearch] button on the main list — it now opens the Export/Import Wizard's import step with type Connection preselected (Admin scope when opened from Administration); the old upload dialog is gone.
- Select the exported package and follow the wizard's steps.
- The wizard checks format, name conflicts and dependency availability before you confirm the import.
Scenario 1: Name Conflict → Overwrite the old connection or create with a new name.
Scenario 2: Missing Dependencies → Create missing certificates or key stores first or remove them during import.
Connection Usage Areas
Steps:
- Create the connection.
- Verify the connection with Test Connection.
- Save and activate with Save and Deploy.
- Ensure the connection is in Enabled status
The connection is selected in steps that require Elasticsearch log, metric, or search data. Examples: steps like "Elasticsearch Index", "Elasticsearch Query", "Elasticsearch Bulk". The connection is selected from the Connection field in these steps' configuration.
In scheduled tasks (e.g., writing logs at certain intervals, index management, etc.), the connection is selected to access the Elasticsearch cluster. When the connection changes, the job behavior is updated accordingly.
Connection accuracy can be checked independently of Integration Flow using the Connection Test feature. This test is critical in the debugging process
Best Practices
Things to Do and Best Practices
Bad: index1.
Good: log-prod.
Best: `prod-apiproxy-log-{yyyy.MM.dd}`
Bad: Not changing defaults.
Good: Setting max size according to daily data volume.
Best: Setting both size and age thresholds and regularly using the rollover button
Bad: Sharing the same certificate across all environments.
Good: Loading environment-based certificates.
Best: Planning certificate rotation with automation and setting expiration alarms
Bad: Giving READ_WRITE to read-only cluster.
Good: Making selection according to permission requirements.
Best: Updating connection type if cluster role changes
Bad: Using the same connection parameters in all environments.
Good: Creating separate connections for each environment.
Best: Managing all environments in a single connection using the Environment option, only changing environment when transitioning between environments
Bad: Saving and deploying connection without testing.
Good: Verifying with Test Connection before saving.
Best: Testing after every parameter change, performing full integration test in test environment before going to production
Security Best Practices
Create separate connections and RBAC users for production cluster; do not share access tokens
Do not put PKCS#12/PEM files in version control; upload through secret storage
Disable Hostname Verification should only be used for testing; recommended to leave as false in production
Store sensitive information such as usernames and passwords using environment variables or secret manager. Do not hardcode credentials in code or configuration files. Update passwords periodically
Always enable SSL/TLS in production environment. Use self-signed certificates only in development environment. Track certificate expiration dates and renew them on time
Allow only authorized users to change connection configuration. Store connection change logs. Apply change approval process for critical connections
Things to Avoid
Why to avoid: Creates conflicts in indices sharing the same template.
Alternative: Use project-based prefix
Why to avoid: All flows stop if single host fails.
Alternative: Enter at least two hosts, monitor health check
Why to avoid: Wrong file type leads to handshake failure.
Alternative: Use certificate package appropriate for HTTPS selection
Why to avoid: Test data may be written to production system, real users may be affected, security risk occurs.
Alternative: Create separate connections for each environment, use environment parameter, separate connection names by adding prefix according to environment (Test_, Prod_)
Why to avoid: Connection continuously times out in network delays, Integration steps fail.
Alternative: Set timeout values according to real usage scenarios, measure network latency and set timeouts accordingly
Why to avoid: The connection pool size per host is fixed (20); high concurrent traffic against a single host can exhaust the pool.
Alternative: Define multiple hosts for high-traffic clusters — the total pool limit scales with the number of hosts. Pool size cannot be adjusted from the screen
Performance Tips
Recommendation: Determine shard count according to daily record volume, set replica count according to cluster capacity.
Effect: Search performance increases, disk usage is balanced
Recommendation: Reduce storage costs by keeping hot phase short and cold phase long.
Effect: Unnecessary data is not kept on expensive nodes
Recommendation: Track bulk/search queue lengths from the monitor screen; if thresholds are exceeded, consider adding more hosts (pool size per host is fixed and cannot be changed from the screen).
Effect: Number of requests waiting in queue decreases
Recommendation: Keep in mind that pool size is fixed per host (20) and cannot be changed from the screen; the only way to increase pool capacity for peak traffic is to define more hosts.
Effect: Connection setup cost decreases, response times improve
Recommendation: Measure real network latency, set timeout values accordingly, avoid very low or very high timeouts.
Effect: Unnecessary waits are prevented, fast fail-over is provided, user experience improves
Recommendation: Monitor connection pool usage, track timeout rates, perform connection health check, set up alerting.
Effect: Problems are proactively detected, performance bottlenecks are identified early, downtime decreases
Troubleshooting
Asynchronous Write Queue Filling Up
Possible causes: bulkBufferCapacity is too low for traffic, the Elasticsearch cluster is responding slowly, or the flusher cannot keep up with the queue.
- Increase
bulkBufferCapacity/bulkMaxBatchSizevia APIops. - Check Elasticsearch cluster health and response times.
- Verify records are reaching the failover connector (a full queue also triggers failover).
- Monitor the
apinizer_es_log_buffer_size/apinizer_es_log_buffer_capacitymetrics.
Index Template Not Created
Administrate may be disabled, Template name may conflict, or Elasticsearch user permission may be insufficient.
Enable Administrate.
Change the template name.
Grant manage_index_templates permission to the user.
ILM Policy Not Saving
Policy name may exist, Hot phase may be disabled, or UI modal may not be closed.
Make the policy name unique.
Enable the Hot phase.
Click Save in the modal and try again.
Connection Timeout
Network delay, target system responding slowly, or timeout value may be too low.
Check network connectivity.
Check target system health.
Increase timeout values.
Review connection logs.
Authentication Failed
Wrong username/password, expired credentials, or permission problem may exist.
Verify credentials.
Check that the user is active in the target system.
Check that necessary permissions are granted.
Check SSL/TLS certificates.
Pool Exhausted
The connection pool size is fixed per host (20 connections); very high concurrent traffic against a single host, or long-running requests, can exhaust the pool. Pool size and idle timeout values cannot be changed from the screen.
Define additional Elasticsearch hosts to spread traffic; the total pool limit scales with the number of hosts.
Check the Elasticsearch cluster side for long-running or stuck requests.
Verify that the Connection Timeout value is realistic; values below 1000 ms always fall back to 5000 ms.
Monitor connection usage metrics.
Connection Test Successful But Integration Flow Errors
Different connection may be selected in Integration/Connector step, step may be misconfigured, or Flow/Job may not be redeployed.
Check that the connection's enable toggle is active.
Verify that the correct connection is selected in Integration Flow.
Redeploy the connection.
Redeploy Integration Flow or Job.
Check Gateway logs.
Frequently Asked Questions (FAQ)
Rollover
Can I use a single connection for two different environments?
Thanks to the environment dropdown, Development/Test/Production values can be kept within the same connection; however, it is safer to create separate connections for access policies.
What does the Rollover button do?
Manually rollovers the active index of the specified connection; can be used in emergencies before ILM threshold is reached.
Can Encrypt Communication be opened without HTTPS host?
No, TLS fields are not visible unless at least one host has HTTPS selected; update host scheme for security requirements.
Does ILM policy apply to all indices?
Indices created with the same template and policy name are affected; if you use different names, manual assignment is required.
What do thread pool data in Monitor screen show?
Shows bulk/search/ingest queue lengths, rejection counts, and active thread count of Elasticsearch nodes; used for performance tuning.
Can I use the same connection in multiple Integration Flows?
Yes, the same connection can be used in multiple Integration Flow or Connector steps. This provides central management and guarantees configuration consistency. However, changes made to the connection will affect all usage locations, so care should be taken.
Is connection pool size configurable?
No. Apinizer always uses a connection pool for Elasticsearch connections automatically (20 connections per host; the total limit scales with the number of hosts). Pool size and idle-connection settings cannot be configured from the screen.
Should I create different connections for Test and Production?
Yes, it is recommended to create separate connections for each environment. Alternatively, you can manage all environments within a single connection using the environment parameter. This approach provides easier management and less error risk.
Test Connection is successful but not working in Integration Flow, why?
Several reasons may exist:
- Connection enable toggle may be passive
- Different connection may be selected in Integration step
- Connection may not be deployed
- Integration Flow may not be redeployed yet
What does the Live Check button do?
It queries whether the ILM Policy, Index Template, and Data Stream actually exist on the Elasticsearch cluster and synchronizes the connection record with this real status. This prevents the indicators from continuing to show status from a previous cluster after the connection is repointed to a different Elasticsearch cluster. If the cluster cannot be reached while checking, an error message is shown and the saved indicators are left unchanged rather than being reset — a temporary outage is not treated as "does not exist".
Can I create a data stream by clicking the Data Stream indicator?
No. Unlike the ILM Policy and Index Template indicators, the Data Stream indicator only shows status and cannot be clicked. The data stream is created automatically during Save and Deploy once ILM Policy and Index Template are ready; use the Live Check button to see the current status.